30
/de/
AIzaSyAYiBZKx7MnpbEhh9jyipgxe19OcubqV5w
April 1, 2024
91152
Brazil
BRA
true
2
1
GDP, PPP (constant 2011 international $)
2016,2015,2014,2013,2012,2011,2010,2009,2008,2007,2006,2005,2004,2003,2002,2001,2000,1999,1998,1997,1996,1995,1994,1993,1992,1991
Download
Bibliothek der Globalstatistik →Brazil →

GDP, PPP (constant 2011 international $)

Diese Statistik in anderen Ländern:

AfghanistanAlbaniaAlgeriaAngolaAntigua and BarbudaArab WorldArgentinaArmeniaArubaAustraliaAustriaAzerbaijanBahamas, TheBahrainBangladeshBarbadosBelarusBelgiumBelizeBeninBermudaBhutanBoliviaBosnia and HerzegovinaBotswanaBrazilBrunei DarussalamBulgariaBurkina FasoBurundiCabo VerdeCambodiaCameroonCanadaCaribbean small statesCayman IslandsCentral African RepublicCentral Europe and the BalticsChadChileChinaColombiaComorosCongo, Dem. Rep.Congo, Rep.Costa RicaCote d'IvoireCroatiaCubaCyprusCzech RepublicDenmarkDjiboutiDominicaDominican RepublicEarly-demographic dividendEast Asia & PacificEast Asia & Pacific (excluding high income)East Asia & Pacific (IDA & IBRD countries)EcuadorEgypt, Arab Rep.El SalvadorEquatorial GuineaEritreaEstoniaEthiopiaEuro areaEurope & Central AsiaEurope & Central Asia (excluding high income)Europe & Central Asia (IDA & IBRD countries)European UnionFijiFinlandFragile and conflict affected situationsFranceGabonGambia, TheGeorgiaGermanyGhanaGreeceGrenadaGuatemalaGuineaGuinea-BissauGuyanaHaitiHeavily indebted poor countries (HIPC)High incomeHondurasHong Kong SAR, ChinaHungaryIBRD onlyIcelandIDA & IBRD totalIDA blendIDA onlyIDA totalIndiaIndonesiaIran, Islamic Rep.IraqIrelandIsraelItalyJamaicaJapanJordanKazakhstanKenyaKiribatiKorea, Rep.KosovoKuwaitKyrgyz RepublicLao PDRLate-demographic dividendLatin America & Caribbean Latin America & Caribbean (excluding high income)Latin America & the Caribbean (IDA & IBRD countries)LatviaLeast developed countries: UN classificationLebanonLesothoLiberiaLibyaLithuaniaLow & middle incomeLow incomeLower middle incomeLuxembourgMacao SAR, ChinaMacedonia, FYRMadagascarMalawiMalaysiaMaldivesMaliMaltaMarshall IslandsMauritaniaMauritiusMexicoMicronesia, Fed. Sts.Middle East & North AfricaMiddle East & North Africa (excluding high income)Middle East & North Africa (IDA & IBRD countries)Middle incomeMoldovaMongoliaMontenegroMoroccoMozambiqueMyanmarNamibiaNauruNepalNetherlandsNew ZealandNicaraguaNigerNigeriaNorth AmericaNorwayOECD membersOmanOther small statesPacific island small statesPakistanPalauPanamaPapua New GuineaParaguayPeruPhilippinesPolandPortugalPost-demographic dividendPre-demographic dividendPuerto RicoQatarRomaniaRussian FederationRwandaSamoaSao Tome and PrincipeSaudi ArabiaSenegalSerbiaSeychellesSierra LeoneSingaporeSint Maarten (Dutch part)Slovak RepublicSloveniaSmall statesSolomon IslandsSouth AfricaSouth AsiaSouth Asia (IDA & IBRD)South SudanSpainSri LankaSt. Kitts and NevisSt. LuciaSt. Vincent and the GrenadinesSub-Saharan Africa Sub-Saharan Africa (excluding high income)Sub-Saharan Africa (IDA & IBRD countries)SudanSurinameSwazilandSwedenSwitzerlandTajikistanTanzaniaThailandTimor-LesteTogoTongaTrinidad and TobagoTunisiaTurkeyTurkmenistanTuvaluUgandaUkraineUnited Arab EmiratesUnited KingdomUnited StatesUpper middle incomeUruguayUzbekistanVanuatuVenezuela, RBVietnamWest Bank and GazaWorldYemen, Rep.ZambiaZimbabwe

Zeitlinie:

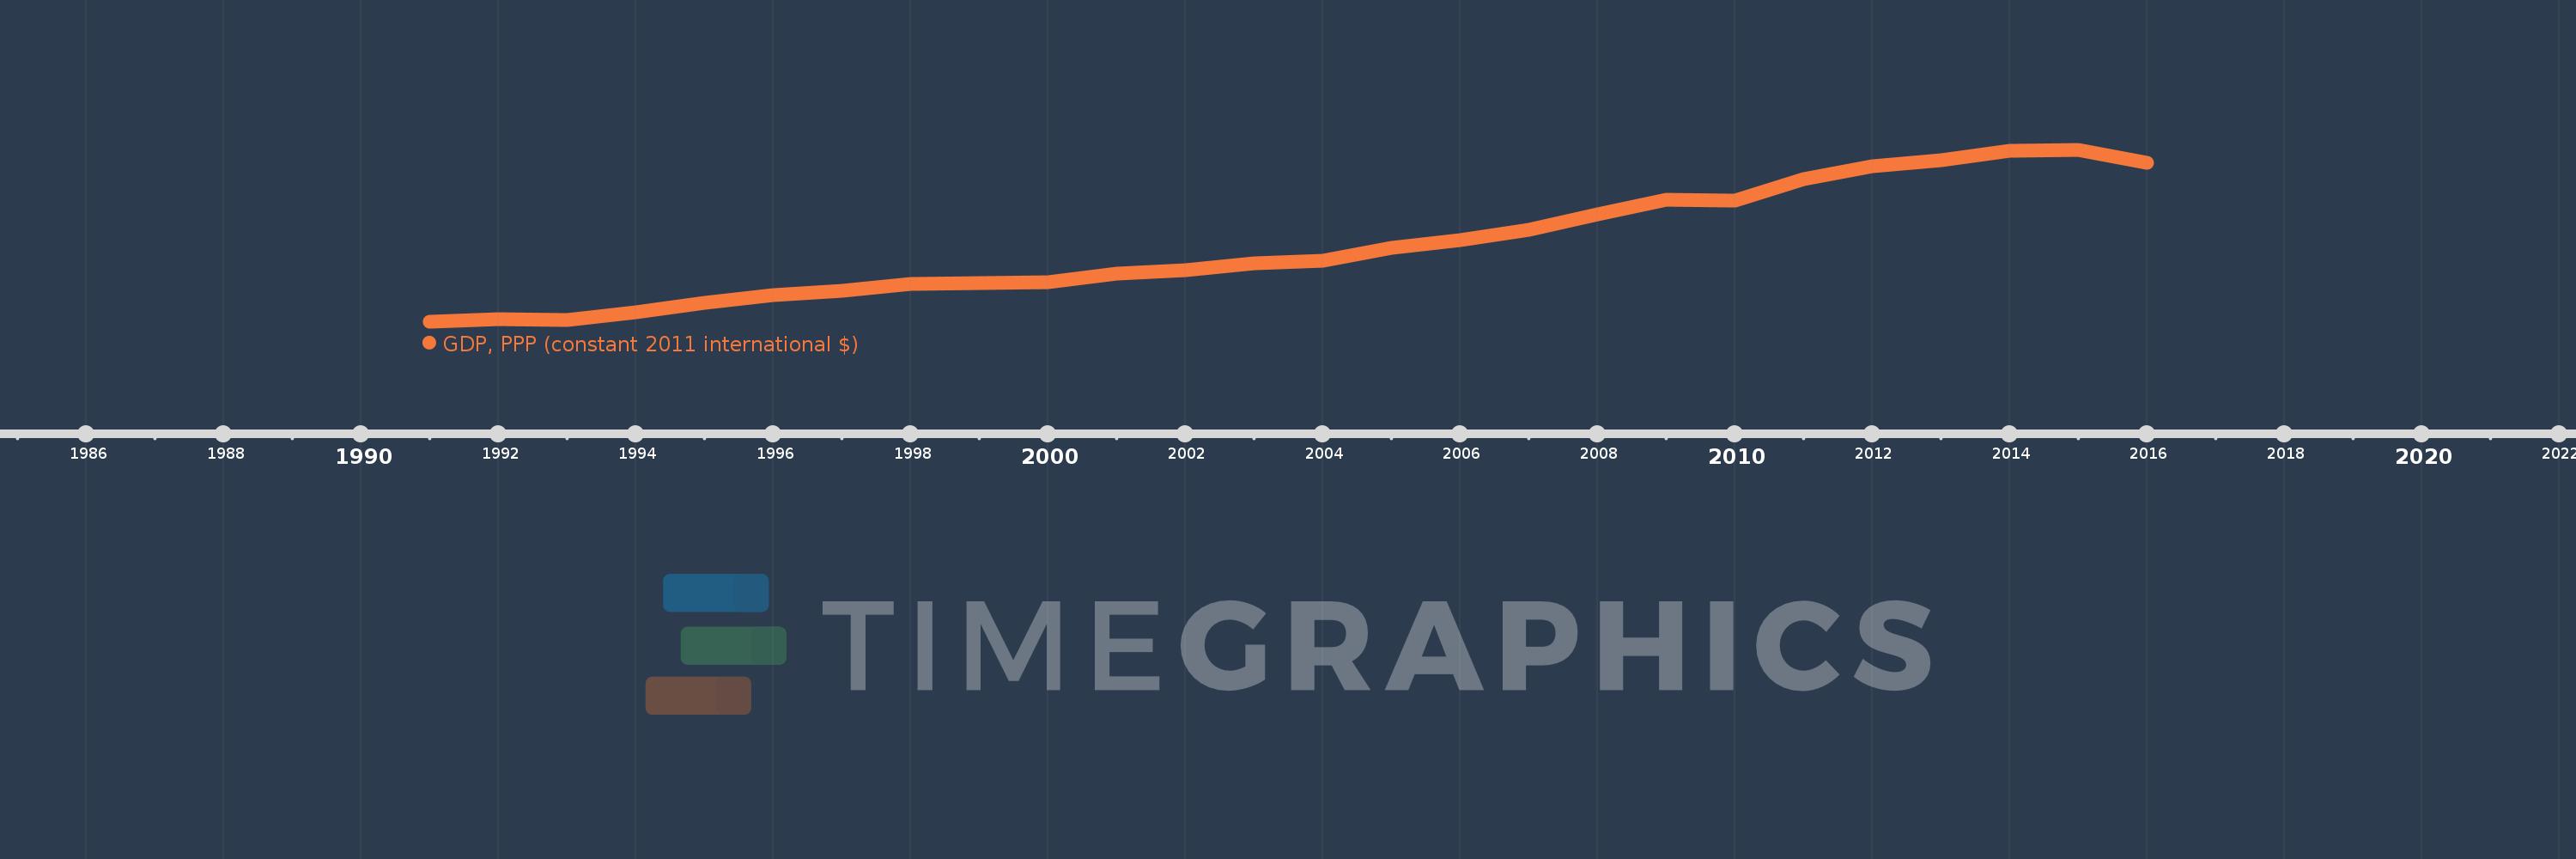
Diese Zeitleiste vorliegt die Graphik ab 1991 J. bis 2016 J. Brazil. Die Angaben bis 1990 J. sind nicht vorhanden. Die Zahl aktueller Beobachtungen nach Daten: 26.

Die Quelle (Bezeichnung):

Kennzahlen der Weltentwicklung

Die Quelle (Einrichtung):

World Bank, International Comparison Program database.

Kategorien:

Economy & Growth

Es wurde aktualisiert:

23 Apr 2017 Jahr

Kennzahlen der Wertänderungen vom Jahr zum Jahr

im Durchschnitt:
2.247 Trln
Minimum:
1.541 Trln
1 Jan 1991 Jahr
Maximum:
3.125 Trln
1 Jan 2015 Jahr
Zum Datum der Beobachtung
Wert
Absolute Veränderung
Die Veränderung bezüglich dem vorherigen Wert
1 Jan 1991 Jahr
1.541 Trln
+1.541 Trln
0.0%
1 Jan 1992 Jahr
1.564 Trln
+23.297 Mlrd.
1.51%
1 Jan 1993 Jahr
1.557 Trln
-7.303 Mlrd.
-0.47%
1 Jan 1994 Jahr
1.63 Trln
+72.632 Mlrd.
4.67%
1 Jan 1995 Jahr
1.716 Trln
+86.928 Mlrd.
5.33%
1 Jan 1996 Jahr
1.792 Trln
+75.811 Mlrd.
4.42%
1 Jan 1997 Jahr
1.832 Trln
+39.565 Mlrd.
2.21%
1 Jan 1998 Jahr
1.894 Trln
+62.191 Mlrd.
3.4%
1 Jan 1999 Jahr
1.9 Trln
+6.409 Mlrd.
0.34%
1 Jan 2000 Jahr
1.909 Trln
+8.914 Mlrd.
0.47%
1 Jan 2001 Jahr
1.988 Trln
+78.523 Mlrd.
4.11%
1 Jan 2002 Jahr
2.021 Trln
+32.955 Mlrd.
1.66%
1 Jan 2003 Jahr
2.083 Trln
+61.699 Mlrd.
3.05%
1 Jan 2004 Jahr
2.106 Trln
+23.747 Mlrd.
1.14%
1 Jan 2005 Jahr
2.228 Trln
+121.34 Mlrd.
5.76%
1 Jan 2006 Jahr
2.299 Trln
+71.329 Mlrd.
3.2%
1 Jan 2007 Jahr
2.39 Trln
+91.05 Mlrd.
3.96%
1 Jan 2008 Jahr
2.535 Trln
+145.127 Mlrd.
6.07%
1 Jan 2009 Jahr
2.664 Trln
+129.133 Mlrd.
5.09%
1 Jan 2010 Jahr
2.661 Trln
-3.361 Mlrd.
-0.13%
1 Jan 2011 Jahr
2.861 Trln
+200.333 Mlrd.
7.53%
1 Jan 2012 Jahr
2.973 Trln
+111.881 Mlrd.
3.91%
1 Jan 2013 Jahr
3.03 Trln
+56.949 Mlrd.
1.92%
1 Jan 2014 Jahr
3.121 Trln
+91.36 Mlrd.
3.02%
1 Jan 2015 Jahr
3.125 Trln
+3.227 Mlrd.
0.1%
1 Jan 2016 Jahr
3.004 Trln
-120.216 Mlrd.
-3.85%

Bewertung der Länder gemäß mit laufender Statistik nach Jahren