30
/de/
AIzaSyAYiBZKx7MnpbEhh9jyipgxe19OcubqV5w
April 1, 2024
154607
India
IND
true
2
1
GDP, PPP (constant 2011 international $)
2016,2015,2014,2013,2012,2011,2010,2009,2008,2007,2006,2005,2004,2003,2002,2001,2000,1999,1998,1997,1996,1995,1994,1993,1992,1991
Download
Bibliothek der Globalstatistik →India →

GDP, PPP (constant 2011 international $)

Diese Statistik in anderen Ländern:

AfghanistanAlbaniaAlgeriaAngolaAntigua and BarbudaArab WorldArgentinaArmeniaArubaAustraliaAustriaAzerbaijanBahamas, TheBahrainBangladeshBarbadosBelarusBelgiumBelizeBeninBermudaBhutanBoliviaBosnia and HerzegovinaBotswanaBrazilBrunei DarussalamBulgariaBurkina FasoBurundiCabo VerdeCambodiaCameroonCanadaCaribbean small statesCayman IslandsCentral African RepublicCentral Europe and the BalticsChadChileChinaColombiaComorosCongo, Dem. Rep.Congo, Rep.Costa RicaCote d'IvoireCroatiaCubaCyprusCzech RepublicDenmarkDjiboutiDominicaDominican RepublicEarly-demographic dividendEast Asia & PacificEast Asia & Pacific (excluding high income)East Asia & Pacific (IDA & IBRD countries)EcuadorEgypt, Arab Rep.El SalvadorEquatorial GuineaEritreaEstoniaEthiopiaEuro areaEurope & Central AsiaEurope & Central Asia (excluding high income)Europe & Central Asia (IDA & IBRD countries)European UnionFijiFinlandFragile and conflict affected situationsFranceGabonGambia, TheGeorgiaGermanyGhanaGreeceGrenadaGuatemalaGuineaGuinea-BissauGuyanaHaitiHeavily indebted poor countries (HIPC)High incomeHondurasHong Kong SAR, ChinaHungaryIBRD onlyIcelandIDA & IBRD totalIDA blendIDA onlyIDA totalIndiaIndonesiaIran, Islamic Rep.IraqIrelandIsraelItalyJamaicaJapanJordanKazakhstanKenyaKiribatiKorea, Rep.KosovoKuwaitKyrgyz RepublicLao PDRLate-demographic dividendLatin America & Caribbean Latin America & Caribbean (excluding high income)Latin America & the Caribbean (IDA & IBRD countries)LatviaLeast developed countries: UN classificationLebanonLesothoLiberiaLibyaLithuaniaLow & middle incomeLow incomeLower middle incomeLuxembourgMacao SAR, ChinaMacedonia, FYRMadagascarMalawiMalaysiaMaldivesMaliMaltaMarshall IslandsMauritaniaMauritiusMexicoMicronesia, Fed. Sts.Middle East & North AfricaMiddle East & North Africa (excluding high income)Middle East & North Africa (IDA & IBRD countries)Middle incomeMoldovaMongoliaMontenegroMoroccoMozambiqueMyanmarNamibiaNauruNepalNetherlandsNew ZealandNicaraguaNigerNigeriaNorth AmericaNorwayOECD membersOmanOther small statesPacific island small statesPakistanPalauPanamaPapua New GuineaParaguayPeruPhilippinesPolandPortugalPost-demographic dividendPre-demographic dividendPuerto RicoQatarRomaniaRussian FederationRwandaSamoaSao Tome and PrincipeSaudi ArabiaSenegalSerbiaSeychellesSierra LeoneSingaporeSint Maarten (Dutch part)Slovak RepublicSloveniaSmall statesSolomon IslandsSouth AfricaSouth AsiaSouth Asia (IDA & IBRD)South SudanSpainSri LankaSt. Kitts and NevisSt. LuciaSt. Vincent and the GrenadinesSub-Saharan Africa Sub-Saharan Africa (excluding high income)Sub-Saharan Africa (IDA & IBRD countries)SudanSurinameSwazilandSwedenSwitzerlandTajikistanTanzaniaThailandTimor-LesteTogoTongaTrinidad and TobagoTunisiaTurkeyTurkmenistanTuvaluUgandaUkraineUnited Arab EmiratesUnited KingdomUnited StatesUpper middle incomeUruguayUzbekistanVanuatuVenezuela, RBVietnamWest Bank and GazaWorldYemen, Rep.ZambiaZimbabwe

Zeitlinie:

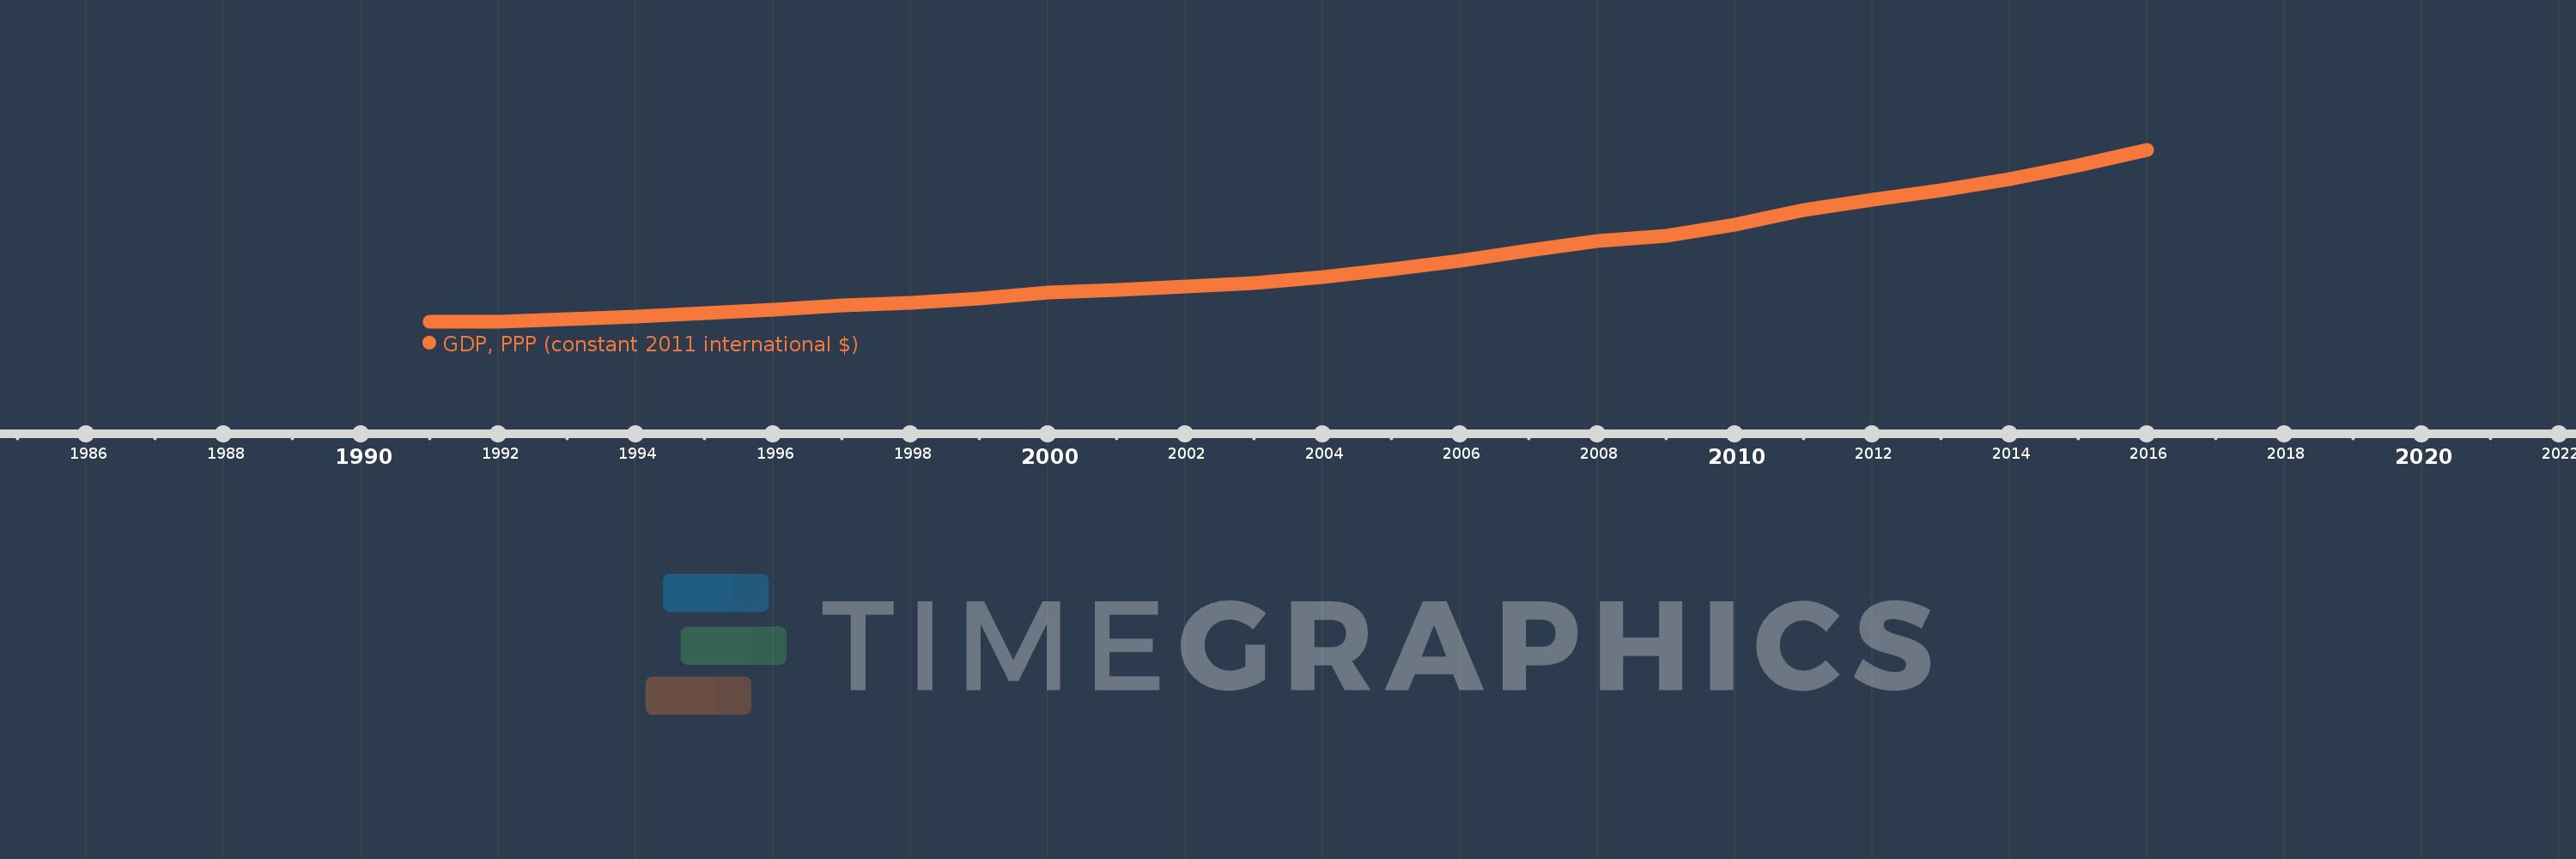
Diese Zeitleiste vorliegt die Graphik ab 1991 J. bis 2016 J. India. Die Angaben bis 1990 J. sind nicht vorhanden. Die Zahl aktueller Beobachtungen nach Daten: 26.

Die Quelle (Bezeichnung):

Kennzahlen der Weltentwicklung

Die Quelle (Einrichtung):

World Bank, International Comparison Program database.

Kategorien:

Economy & Growth

Es wurde aktualisiert:

23 Apr 2017 Jahr

Kennzahlen der Wertänderungen vom Jahr zum Jahr

im Durchschnitt:
3.622 Trln
Minimum:
1.544 Trln
1 Jan 1991 Jahr
Maximum:
7.512 Trln
1 Jan 2016 Jahr
Zum Datum der Beobachtung
Wert
Absolute Veränderung
Die Veränderung bezüglich dem vorherigen Wert
1 Jan 1991 Jahr
1.544 Trln
+1.544 Trln
0.0%
1 Jan 1992 Jahr
1.56 Trln
+16.314 Mlrd.
1.06%
1 Jan 1993 Jahr
1.646 Trln
+85.525 Mlrd.
5.48%
1 Jan 1994 Jahr
1.724 Trln
+78.175 Mlrd.
4.75%
1 Jan 1995 Jahr
1.838 Trln
+114.78 Mlrd.
6.66%
1 Jan 1996 Jahr
1.978 Trln
+139.255 Mlrd.
7.57%
1 Jan 1997 Jahr
2.127 Trln
+149.309 Mlrd.
7.55%
1 Jan 1998 Jahr
2.213 Trln
+86.141 Mlrd.
4.05%
1 Jan 1999 Jahr
2.35 Trln
+136.873 Mlrd.
6.18%
1 Jan 2000 Jahr
2.558 Trln
+207.88 Mlrd.
8.85%
1 Jan 2001 Jahr
2.656 Trln
+98.25 Mlrd.
3.84%
1 Jan 2002 Jahr
2.784 Trln
+128.134 Mlrd.
4.82%
1 Jan 2003 Jahr
2.89 Trln
+105.915 Mlrd.
3.8%
1 Jan 2004 Jahr
3.117 Trln
+227.184 Mlrd.
7.86%
1 Jan 2005 Jahr
3.364 Trln
+246.991 Mlrd.
7.92%
1 Jan 2006 Jahr
3.677 Trln
+312.38 Mlrd.
9.28%
1 Jan 2007 Jahr
4.017 Trln
+340.616 Mlrd.
9.26%
1 Jan 2008 Jahr
4.363 Trln
+345.827 Mlrd.
8.61%
1 Jan 2009 Jahr
4.533 Trln
+169.772 Mlrd.
3.89%
1 Jan 2010 Jahr
4.917 Trln
+384.389 Mlrd.
8.48%
1 Jan 2011 Jahr
5.422 Trln
+504.523 Mlrd.
10.26%
1 Jan 2012 Jahr
5.782 Trln
+359.927 Mlrd.
6.64%
1 Jan 2013 Jahr
6.107 Trln
+324.857 Mlrd.
5.62%
1 Jan 2014 Jahr
6.512 Trln
+405.412 Mlrd.
6.64%
1 Jan 2015 Jahr
6.984 Trln
+471.703 Mlrd.
7.24%
1 Jan 2016 Jahr
7.512 Trln
+528.212 Mlrd.
7.56%

Bewertung der Länder gemäß mit laufender Statistik nach Jahren