29
/de/
de
AIzaSyAYiBZKx7MnpbEhh9jyipgxe19OcubqV5w
April 1, 2024
86223
Bhutan
BTN
true
2
1
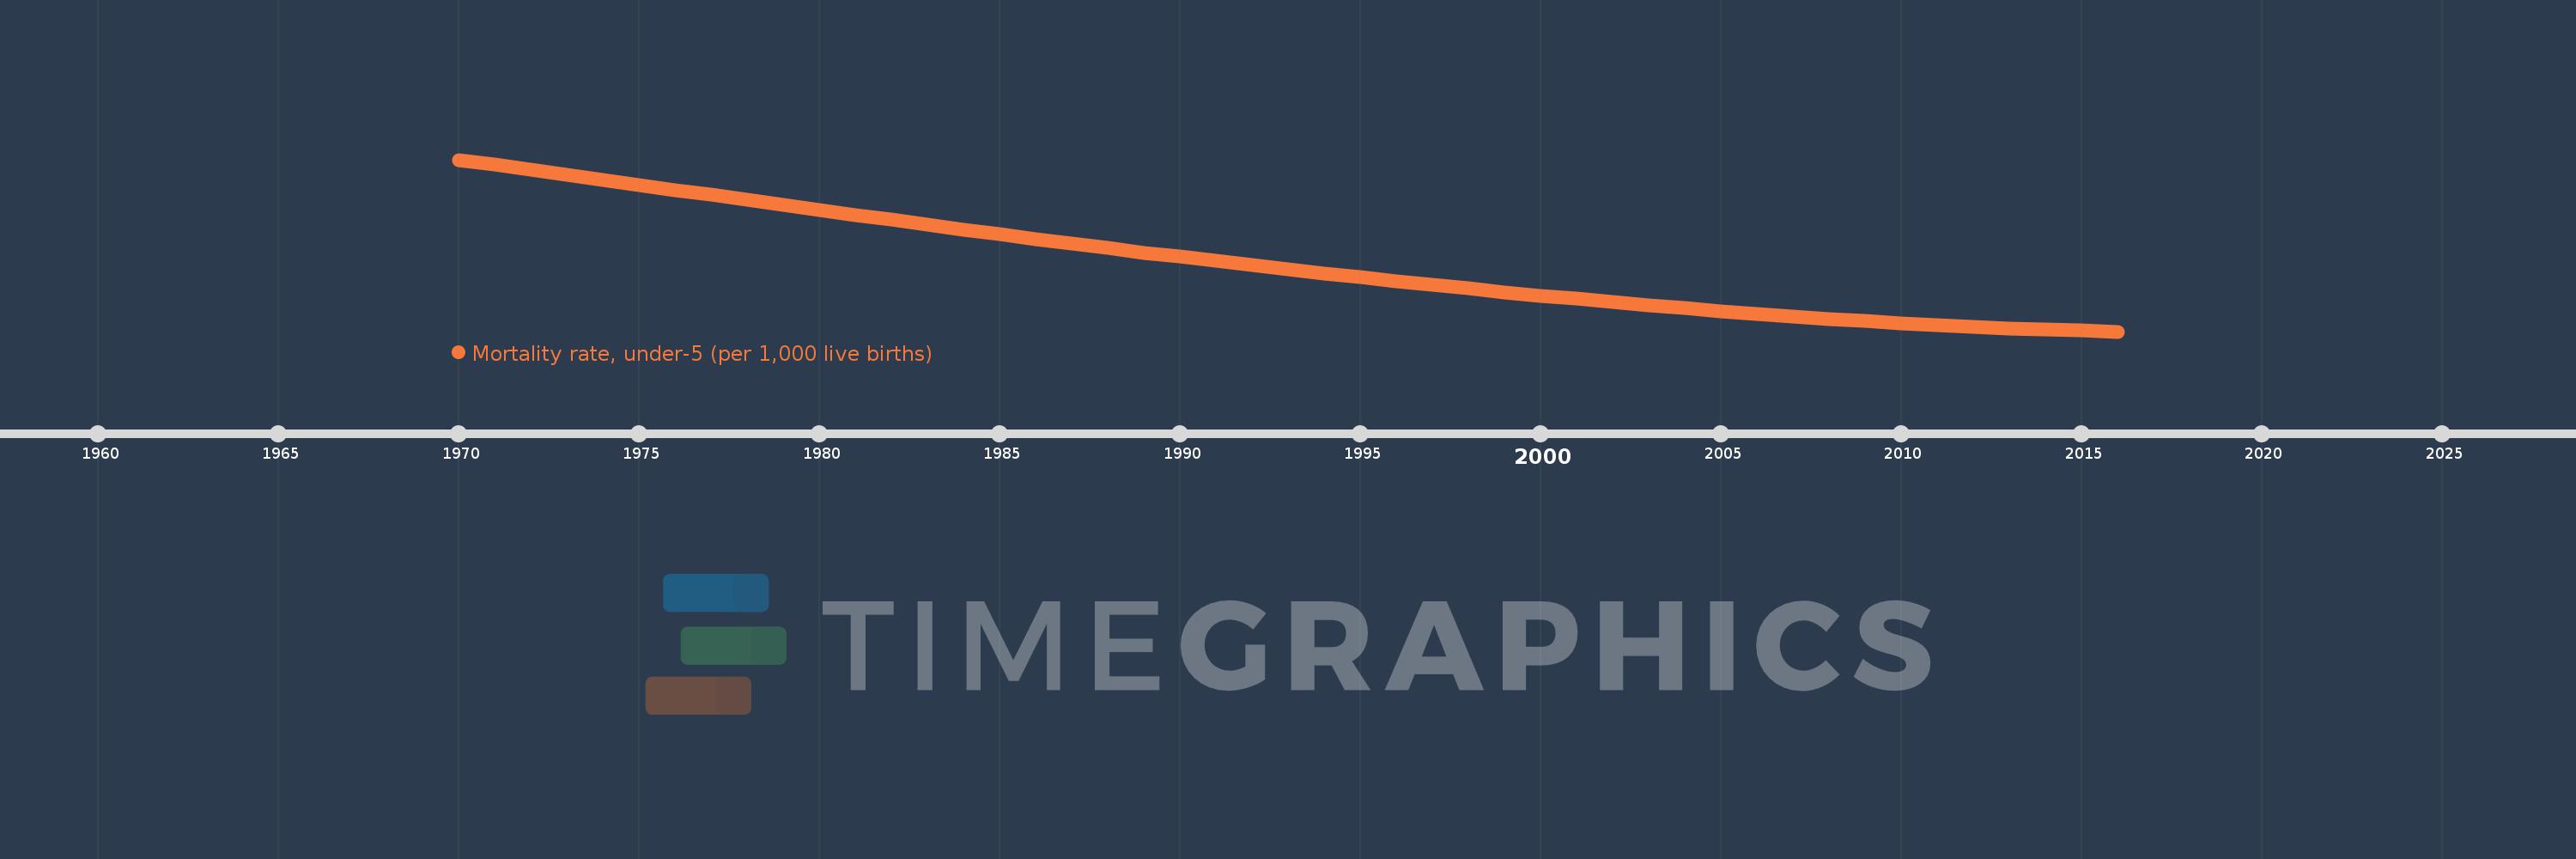
Mortality rate, under-5 (per 1,000 live births)
2016,2015,2014,2013,2012,2011,2010,2009,2008,2007,2006,2005,2004,2003,2002,2001,2000,1999,1998,1997,1996,1995,1994,1993,1992,1991,1990,1989,1988,1987,1986,1985,1984,1983,1982,1981,1980,1979,1978,1977,1976,1975,1974,1973,1972,1971,1970
Diese Statistik in anderen Ländern:
AfghanistanAlbaniaAlgeriaAndorraAngolaAntigua and BarbudaArab WorldArgentinaArmeniaAustraliaAustriaAzerbaijanBahamas, TheBahrainBangladeshBarbadosBelarusBelgiumBelizeBeninBhutanBoliviaBosnia and HerzegovinaBotswanaBrazilBrunei DarussalamBulgariaBurkina FasoBurundiCabo VerdeCambodiaCameroonCanadaCaribbean small statesCentral African RepublicCentral Europe and the BalticsChadChileChinaColombiaComorosCongo, Dem. Rep.Congo, Rep.Costa RicaCote d'IvoireCroatiaCubaCyprusCzech RepublicDenmarkDjiboutiDominicaDominican RepublicEarly-demographic dividendEast Asia & PacificEast Asia & Pacific (excluding high income)East Asia & Pacific (IDA & IBRD countries)EcuadorEgypt, Arab Rep.El SalvadorEquatorial GuineaEritreaEstoniaEthiopiaEuro areaEurope & Central AsiaEurope & Central Asia (excluding high income)Europe & Central Asia (IDA & IBRD countries)European UnionFijiFinlandFragile and conflict affected situationsFranceGabonGambia, TheGeorgiaGermanyGhanaGreeceGrenadaGuatemalaGuineaGuinea-BissauGuyanaHaitiHeavily indebted poor countries (HIPC)High incomeHondurasHungaryIBRD onlyIcelandIDA & IBRD totalIDA blendIDA onlyIDA totalIndiaIndonesiaIran, Islamic Rep.IraqIrelandIsraelItalyJamaicaJapanJordanKazakhstanKenyaKiribatiKorea, Dem. People’s Rep.Korea, Rep.KuwaitKyrgyz RepublicLao PDRLate-demographic dividendLatin America & Caribbean Latin America & Caribbean (excluding high income)Latin America & the Caribbean (IDA & IBRD countries)LatviaLeast developed countries: UN classificationLebanonLesothoLiberiaLibyaLithuaniaLow & middle incomeLow incomeLower middle incomeLuxembourgMacedonia, FYRMadagascarMalawiMalaysiaMaldivesMaliMaltaMarshall IslandsMauritaniaMauritiusMexicoMicronesia, Fed. Sts.Middle East & North AfricaMiddle East & North Africa (excluding high income)Middle East & North Africa (IDA & IBRD countries)Middle incomeMoldovaMonacoMongoliaMontenegroMoroccoMozambiqueMyanmarNamibiaNauruNepalNetherlandsNew ZealandNicaraguaNigerNigeriaNorth AmericaNorwayOECD membersOmanOther small statesPacific island small statesPakistanPalauPanamaPapua New GuineaParaguayPeruPhilippinesPolandPortugalPost-demographic dividendPre-demographic dividendQatarRomaniaRussian FederationRwandaSamoaSan MarinoSao Tome and PrincipeSaudi ArabiaSenegalSerbiaSeychellesSierra LeoneSingaporeSlovak RepublicSloveniaSmall statesSolomon IslandsSomaliaSouth AfricaSouth AsiaSouth Asia (IDA & IBRD)South SudanSpainSri LankaSt. Kitts and NevisSt. LuciaSt. Vincent and the GrenadinesSub-Saharan Africa Sub-Saharan Africa (excluding high income)Sub-Saharan Africa (IDA & IBRD countries)SudanSurinameSwazilandSwedenSwitzerlandSyrian Arab RepublicTajikistanTanzaniaThailandTimor-LesteTogoTongaTrinidad and TobagoTunisiaTurkeyTurkmenistanTuvaluUgandaUkraineUnited Arab EmiratesUnited KingdomUnited StatesUpper middle incomeUruguayUzbekistanVanuatuVenezuela, RBVietnamWest Bank and GazaWorldYemen, Rep.ZambiaZimbabwe Zeitlinie:
Diese Zeitleiste vorliegt die Graphik ab 1970 J. bis 2016 J. Bhutan. Die Angaben bis 1969 J. sind nicht vorhanden. Die Zahl aktueller Beobachtungen nach Daten: 47.
Die Quelle (Bezeichnung):
Kennzahlen der Weltentwicklung
Die Quelle (Einrichtung):
Estimates Developed by the UN Inter-agency Group for Child Mortality Estimation (UNICEF, WHO, World Bank, UN DESA Population Division) at www.childmortality.org. Projected data are from the United Nations Population Division's World Population Prospects; and may in some cases not be consistent with data before the current year.
Kategorien:
Health, Aid Effectiveness, Climate Change
Es wurde aktualisiert:
23 Apr 2017 Jahr
Kennzahlen der Wertänderungen vom Jahr zum Jahr
Minimum:
32.9
1 Jan 2016 Jahr
Maximum:
278.6
1 Jan 1970 Jahr
Zum Datum der Beobachtung
Wert
Absolute Veränderung
Die Veränderung bezüglich dem vorherigen Wert
1 Jan 1970 Jahr
278.6
+278.6
0.0%
1 Jan 1971 Jahr
271.5
-7.1
-2.55%
1 Jan 1972 Jahr
264.2
-7.3
-2.69%
1 Jan 1973 Jahr
256.7
-7.5
-2.84%
1 Jan 1974 Jahr
249.5
-7.2
-2.8%
1 Jan 1975 Jahr
242.4
-7.1
-2.85%
1 Jan 1976 Jahr
235.5
-6.9
-2.85%
1 Jan 1977 Jahr
228.4
-7.1
-3.01%
1 Jan 1978 Jahr
221.3
-7.1
-3.11%
1 Jan 1979 Jahr
214.1
-7.2
-3.25%
1 Jan 1980 Jahr
206.9
-7.2
-3.36%
1 Jan 1981 Jahr
199.8
-7.1
-3.43%
1 Jan 1982 Jahr
193.0
-6.8
-3.4%
1 Jan 1983 Jahr
185.9
-7.1
-3.68%
1 Jan 1984 Jahr
178.9
-7.0
-3.77%
1 Jan 1985 Jahr
172.1
-6.8
-3.8%
1 Jan 1986 Jahr
165.2
-6.9
-4.01%
1 Jan 1987 Jahr
158.8
-6.4
-3.87%
1 Jan 1988 Jahr
152.2
-6.6
-4.16%
1 Jan 1989 Jahr
145.9
-6.3
-4.14%
1 Jan 1990 Jahr
139.8
-6.1
-4.18%
1 Jan 1991 Jahr
133.7
-6.1
-4.36%
1 Jan 1992 Jahr
127.8
-5.9
-4.41%
1 Jan 1993 Jahr
122.0
-5.8
-4.54%
1 Jan 1994 Jahr
116.4
-5.6
-4.59%
1 Jan 1995 Jahr
110.8
-5.6
-4.81%
1 Jan 1996 Jahr
105.3
-5.5
-4.96%
1 Jan 1997 Jahr
99.8
-5.5
-5.22%
1 Jan 1998 Jahr
94.5
-5.3
-5.31%
1 Jan 1999 Jahr
89.4
-5.1
-5.4%
1 Jan 2000 Jahr
84.4
-5.0
-5.59%
1 Jan 2001 Jahr
79.6
-4.8
-5.69%
1 Jan 2002 Jahr
75.0
-4.6
-5.78%
1 Jan 2003 Jahr
70.6
-4.4
-5.87%
1 Jan 2004 Jahr
66.4
-4.2
-5.95%
1 Jan 2005 Jahr
62.3
-4.1
-6.17%
1 Jan 2006 Jahr
58.5
-3.8
-6.1%
1 Jan 2007 Jahr
54.8
-3.7
-6.32%
1 Jan 2008 Jahr
51.3
-3.5
-6.39%
1 Jan 2009 Jahr
48.1
-3.2
-6.24%
1 Jan 2010 Jahr
45.1
-3.0
-6.24%
1 Jan 2011 Jahr
42.3
-2.8
-6.21%
1 Jan 2012 Jahr
39.9
-2.4
-5.67%
1 Jan 2013 Jahr
37.8
-2.1
-5.26%
1 Jan 2014 Jahr
36.0
-1.8
-4.76%
1 Jan 2015 Jahr
34.4
-1.6
-4.44%
1 Jan 2016 Jahr
32.9
-1.5
-4.36%
Bewertung der Länder gemäß mit laufender Statistik nach Jahren


Kommentare: