29
/de/
de
AIzaSyAYiBZKx7MnpbEhh9jyipgxe19OcubqV5w
April 1, 2024
25935
Central Europe and the Baltics
CEB
false
2
1
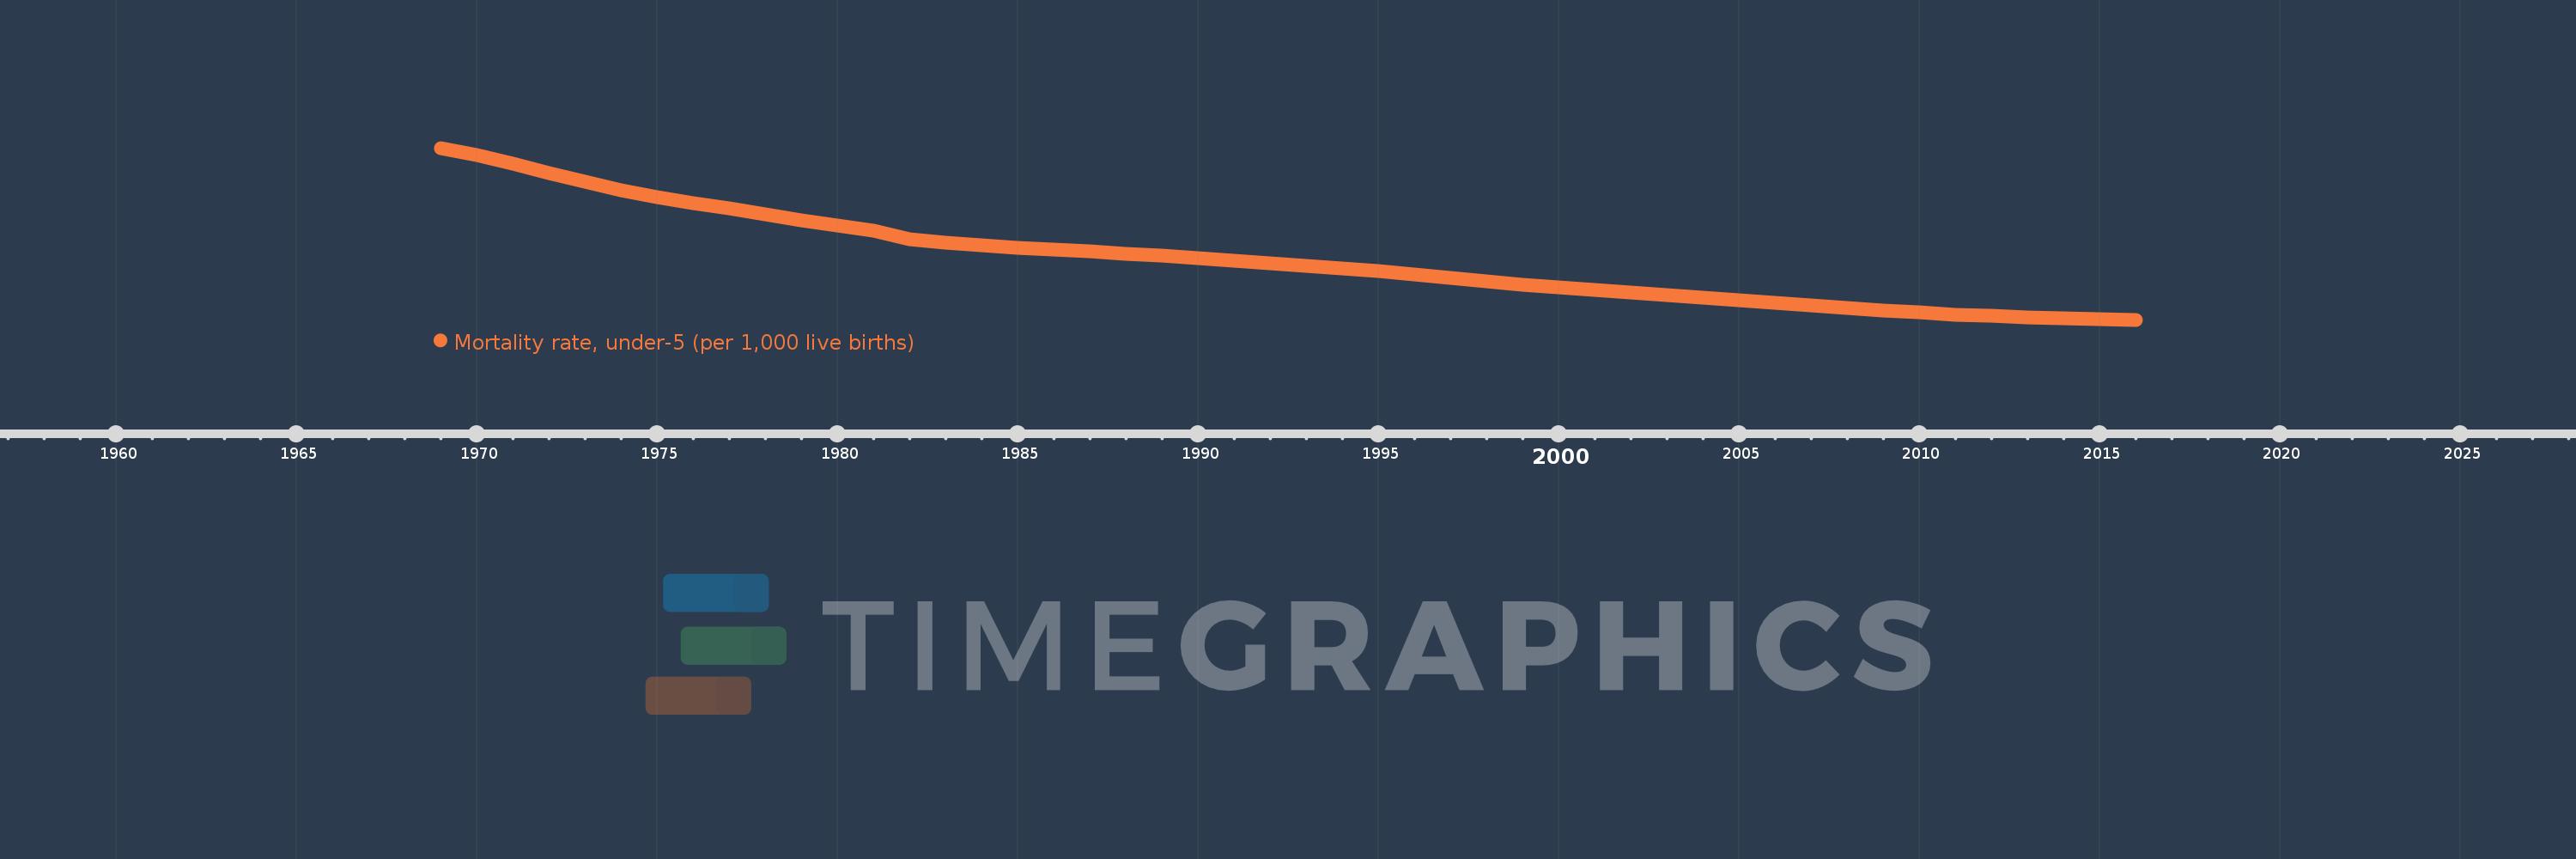
Mortality rate, under-5 (per 1,000 live births)
2016,2015,2014,2013,2012,2011,2010,2009,2008,2007,2006,2005,2004,2003,2002,2001,2000,1999,1998,1997,1996,1995,1994,1993,1992,1991,1990,1989,1988,1987,1986,1985,1984,1983,1982,1981,1980,1979,1978,1977,1976,1975,1974,1973,1972,1971,1970,1969
Diese Statistik in anderen Ländern:
AfghanistanAlbaniaAlgeriaAndorraAngolaAntigua and BarbudaArab WorldArgentinaArmeniaAustraliaAustriaAzerbaijanBahamas, TheBahrainBangladeshBarbadosBelarusBelgiumBelizeBeninBhutanBoliviaBosnia and HerzegovinaBotswanaBrazilBrunei DarussalamBulgariaBurkina FasoBurundiCabo VerdeCambodiaCameroonCanadaCaribbean small statesCentral African RepublicCentral Europe and the BalticsChadChileChinaColombiaComorosCongo, Dem. Rep.Congo, Rep.Costa RicaCote d'IvoireCroatiaCubaCyprusCzech RepublicDenmarkDjiboutiDominicaDominican RepublicEarly-demographic dividendEast Asia & PacificEast Asia & Pacific (excluding high income)East Asia & Pacific (IDA & IBRD countries)EcuadorEgypt, Arab Rep.El SalvadorEquatorial GuineaEritreaEstoniaEthiopiaEuro areaEurope & Central AsiaEurope & Central Asia (excluding high income)Europe & Central Asia (IDA & IBRD countries)European UnionFijiFinlandFragile and conflict affected situationsFranceGabonGambia, TheGeorgiaGermanyGhanaGreeceGrenadaGuatemalaGuineaGuinea-BissauGuyanaHaitiHeavily indebted poor countries (HIPC)High incomeHondurasHungaryIBRD onlyIcelandIDA & IBRD totalIDA blendIDA onlyIDA totalIndiaIndonesiaIran, Islamic Rep.IraqIrelandIsraelItalyJamaicaJapanJordanKazakhstanKenyaKiribatiKorea, Dem. People’s Rep.Korea, Rep.KuwaitKyrgyz RepublicLao PDRLate-demographic dividendLatin America & Caribbean Latin America & Caribbean (excluding high income)Latin America & the Caribbean (IDA & IBRD countries)LatviaLeast developed countries: UN classificationLebanonLesothoLiberiaLibyaLithuaniaLow & middle incomeLow incomeLower middle incomeLuxembourgMacedonia, FYRMadagascarMalawiMalaysiaMaldivesMaliMaltaMarshall IslandsMauritaniaMauritiusMexicoMicronesia, Fed. Sts.Middle East & North AfricaMiddle East & North Africa (excluding high income)Middle East & North Africa (IDA & IBRD countries)Middle incomeMoldovaMonacoMongoliaMontenegroMoroccoMozambiqueMyanmarNamibiaNauruNepalNetherlandsNew ZealandNicaraguaNigerNigeriaNorth AmericaNorwayOECD membersOmanOther small statesPacific island small statesPakistanPalauPanamaPapua New GuineaParaguayPeruPhilippinesPolandPortugalPost-demographic dividendPre-demographic dividendQatarRomaniaRussian FederationRwandaSamoaSan MarinoSao Tome and PrincipeSaudi ArabiaSenegalSerbiaSeychellesSierra LeoneSingaporeSlovak RepublicSloveniaSmall statesSolomon IslandsSomaliaSouth AfricaSouth AsiaSouth Asia (IDA & IBRD)South SudanSpainSri LankaSt. Kitts and NevisSt. LuciaSt. Vincent and the GrenadinesSub-Saharan Africa Sub-Saharan Africa (excluding high income)Sub-Saharan Africa (IDA & IBRD countries)SudanSurinameSwazilandSwedenSwitzerlandSyrian Arab RepublicTajikistanTanzaniaThailandTimor-LesteTogoTongaTrinidad and TobagoTunisiaTurkeyTurkmenistanTuvaluUgandaUkraineUnited Arab EmiratesUnited KingdomUnited StatesUpper middle incomeUruguayUzbekistanVanuatuVenezuela, RBVietnamWest Bank and GazaWorldYemen, Rep.ZambiaZimbabwe Zeitlinie:
Diese Zeitleiste vorliegt die Graphik ab 1969 J. bis 2016 J. Central Europe and the Baltics. Die Angaben bis 1968 J. sind nicht vorhanden. Die Zahl aktueller Beobachtungen nach Daten: 48.
Die Quelle (Bezeichnung):
Kennzahlen der Weltentwicklung
Die Quelle (Einrichtung):
Estimates Developed by the UN Inter-agency Group for Child Mortality Estimation (UNICEF, WHO, World Bank, UN DESA Population Division) at www.childmortality.org. Projected data are from the United Nations Population Division's World Population Prospects; and may in some cases not be consistent with data before the current year.
Kategorien:
Health, Aid Effectiveness, Climate Change
Es wurde aktualisiert:
23 Apr 2017 Jahr
Kennzahlen der Wertänderungen vom Jahr zum Jahr
Minimum:
6.509
1 Jan 2016 Jahr
Maximum:
50.545
1 Jan 1969 Jahr
Zum Datum der Beobachtung
Wert
Absolute Veränderung
Die Veränderung bezüglich dem vorherigen Wert
1 Jan 1969 Jahr
50.545
+50.545
0.0%
1 Jan 1970 Jahr
48.68
-1.866
-3.69%
1 Jan 1971 Jahr
46.424
-2.256
-4.63%
1 Jan 1972 Jahr
44.051
-2.373
-5.11%
1 Jan 1973 Jahr
41.827
-2.224
-5.05%
1 Jan 1974 Jahr
39.775
-2.051
-4.9%
1 Jan 1975 Jahr
37.974
-1.802
-4.53%
1 Jan 1976 Jahr
36.476
-1.497
-3.94%
1 Jan 1977 Jahr
35.062
-1.415
-3.88%
1 Jan 1978 Jahr
33.563
-1.499
-4.28%
1 Jan 1979 Jahr
32.084
-1.479
-4.41%
1 Jan 1980 Jahr
30.578
-1.506
-4.69%
1 Jan 1981 Jahr
29.407
-1.171
-3.83%
1 Jan 1982 Jahr
27.038
-2.368
-8.05%
1 Jan 1983 Jahr
26.225
-0.813
-3.01%
1 Jan 1984 Jahr
25.554
-0.672
-2.56%
1 Jan 1985 Jahr
25.019
-0.535
-2.09%
1 Jan 1986 Jahr
24.492
-0.527
-2.11%
1 Jan 1987 Jahr
23.966
-0.525
-2.15%
1 Jan 1988 Jahr
23.455
-0.511
-2.13%
1 Jan 1989 Jahr
22.943
-0.512
-2.18%
1 Jan 1990 Jahr
22.359
-0.584
-2.55%
1 Jan 1991 Jahr
21.69
-0.668
-2.99%
1 Jan 1992 Jahr
21.032
-0.659
-3.04%
1 Jan 1993 Jahr
20.392
-0.64
-3.04%
1 Jan 1994 Jahr
19.735
-0.657
-3.22%
1 Jan 1995 Jahr
19.004
-0.731
-3.71%
1 Jan 1996 Jahr
18.127
-0.877
-4.61%
1 Jan 1997 Jahr
17.239
-0.888
-4.9%
1 Jan 1998 Jahr
16.366
-0.872
-5.06%
1 Jan 1999 Jahr
15.499
-0.868
-5.3%
1 Jan 2000 Jahr
14.754
-0.745
-4.8%
1 Jan 2001 Jahr
14.074
-0.68
-4.61%
1 Jan 2002 Jahr
13.446
-0.628
-4.46%
1 Jan 2003 Jahr
12.856
-0.59
-4.39%
1 Jan 2004 Jahr
12.231
-0.625
-4.86%
1 Jan 2005 Jahr
11.589
-0.642
-5.25%
1 Jan 2006 Jahr
10.941
-0.648
-5.59%
1 Jan 2007 Jahr
10.236
-0.705
-6.44%
1 Jan 2008 Jahr
9.556
-0.68
-6.65%
1 Jan 2009 Jahr
8.949
-0.607
-6.35%
1 Jan 2010 Jahr
8.339
-0.61
-6.81%
1 Jan 2011 Jahr
7.847
-0.493
-5.91%
1 Jan 2012 Jahr
7.447
-0.4
-5.09%
1 Jan 2013 Jahr
7.115
-0.332
-4.45%
1 Jan 2014 Jahr
6.878
-0.238
-3.34%
1 Jan 2015 Jahr
6.677
-0.2
-2.91%
1 Jan 2016 Jahr
6.509
-0.169
-2.53%
Bewertung der Länder gemäß mit laufender Statistik nach Jahren


Kommentare: