29
/de/
de
AIzaSyAYiBZKx7MnpbEhh9jyipgxe19OcubqV5w
April 1, 2024
73952
Austria
AUT
true
2
1
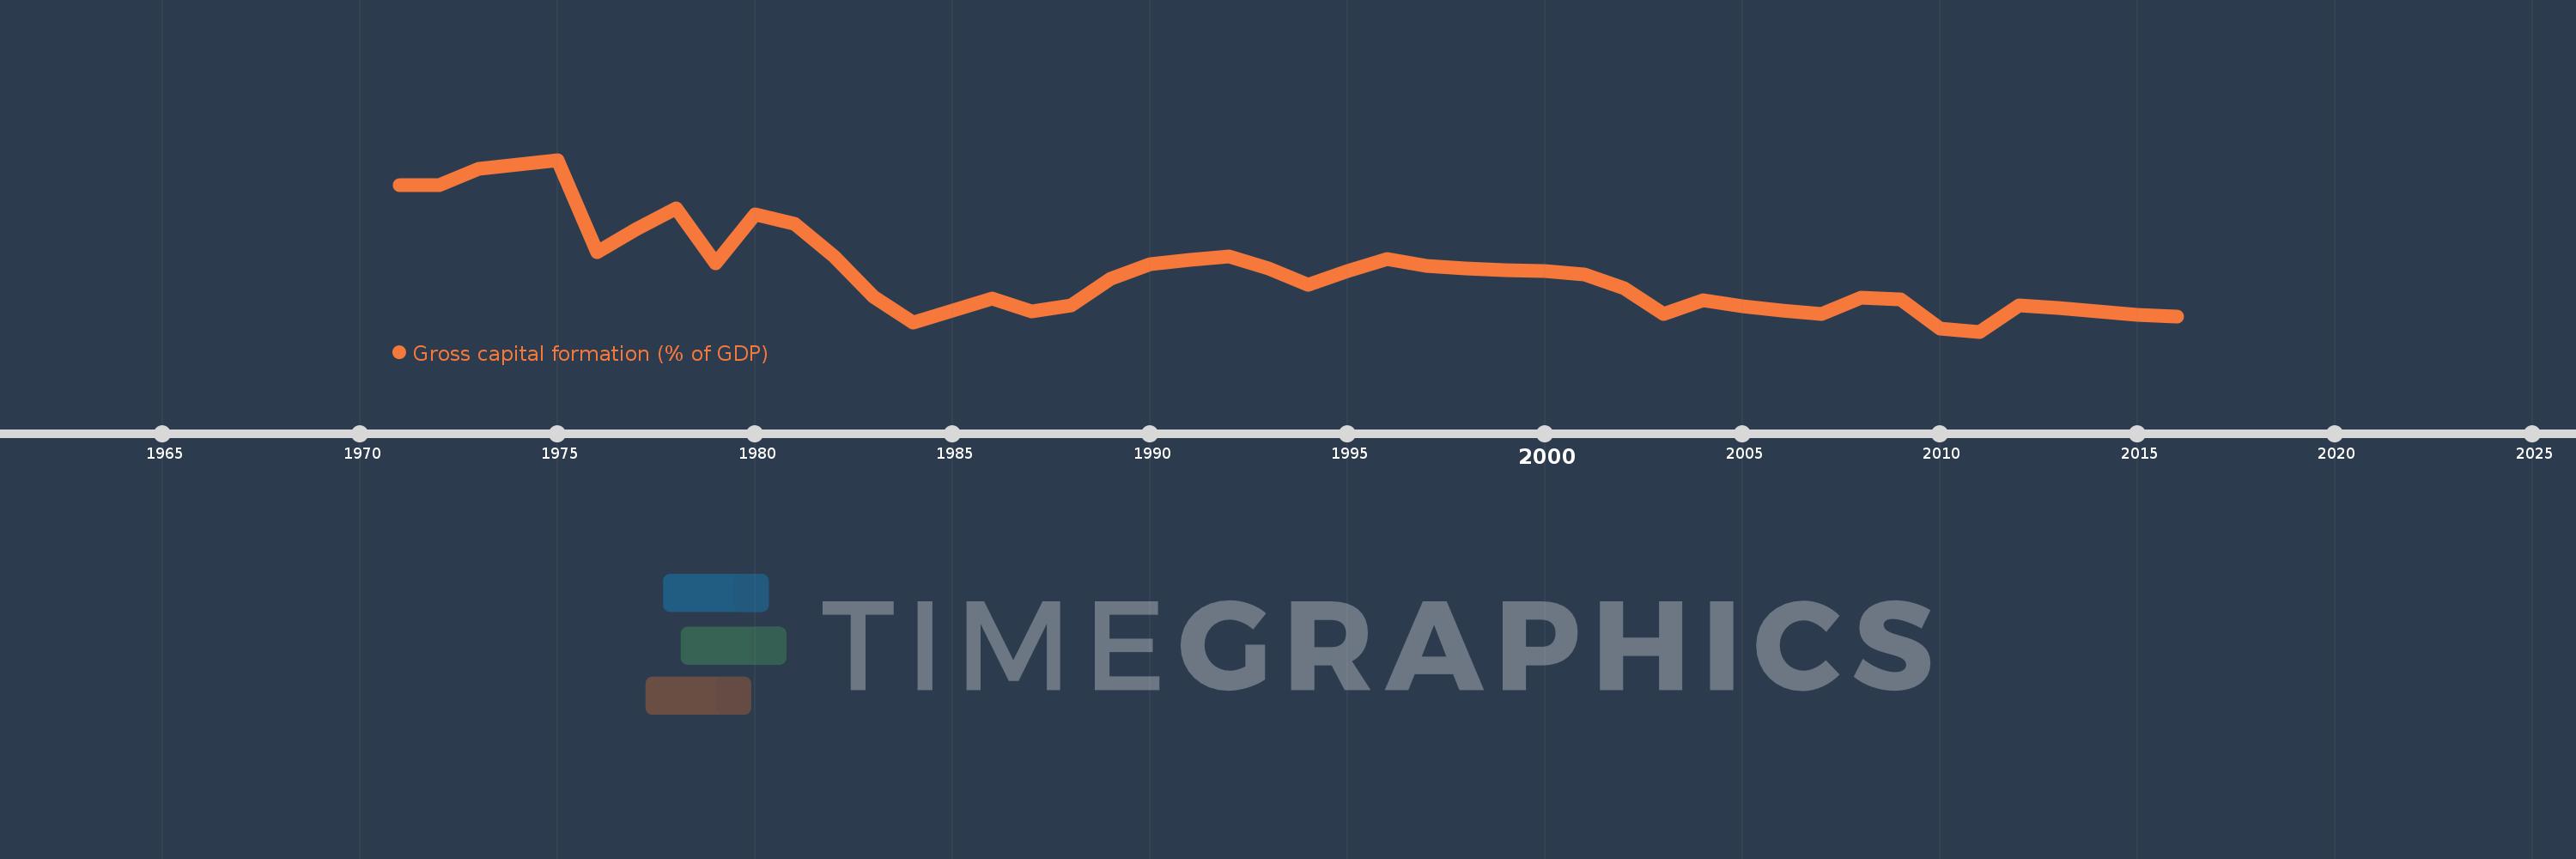
Gross capital formation (% of GDP)
2016,2015,2014,2013,2012,2011,2010,2009,2008,2007,2006,2005,2004,2003,2002,2001,2000,1999,1998,1997,1996,1995,1994,1993,1992,1991,1990,1989,1988,1987,1986,1985,1984,1983,1982,1981,1980,1979,1978,1977,1976,1975,1974,1973,1972,1971
Diese Statistik in anderen Ländern:
AfghanistanAlbaniaAlgeriaAngolaAntigua and BarbudaArab WorldArgentinaArmeniaArubaAustraliaAustriaAzerbaijanBahamas, TheBahrainBangladeshBarbadosBelarusBelgiumBelizeBeninBermudaBhutanBoliviaBosnia and HerzegovinaBotswanaBrazilBrunei DarussalamBulgariaBurkina FasoBurundiCabo VerdeCambodiaCameroonCanadaCaribbean small statesCentral African RepublicCentral Europe and the BalticsChadChileChinaColombiaComorosCongo, Dem. Rep.Congo, Rep.Costa RicaCote d'IvoireCroatiaCubaCyprusCzech RepublicDenmarkDjiboutiDominicaDominican RepublicEarly-demographic dividendEast Asia & PacificEast Asia & Pacific (excluding high income)East Asia & Pacific (IDA & IBRD countries)EcuadorEgypt, Arab Rep.El SalvadorEquatorial GuineaEritreaEstoniaEthiopiaEuro areaEurope & Central AsiaEurope & Central Asia (excluding high income)Europe & Central Asia (IDA & IBRD countries)European UnionFaroe IslandsFijiFinlandFragile and conflict affected situationsFranceGabonGambia, TheGeorgiaGermanyGhanaGreeceGrenadaGuatemalaGuineaGuinea-BissauGuyanaHaitiHeavily indebted poor countries (HIPC)High incomeHondurasHong Kong SAR, ChinaHungaryIBRD onlyIcelandIDA & IBRD totalIDA blendIDA onlyIDA totalIndiaIndonesiaIran, Islamic Rep.IraqIrelandIsraelItalyJamaicaJapanJordanKazakhstanKenyaKiribatiKorea, Rep.KosovoKuwaitKyrgyz RepublicLao PDRLate-demographic dividendLatin America & Caribbean Latin America & Caribbean (excluding high income)Latin America & the Caribbean (IDA & IBRD countries)LatviaLeast developed countries: UN classificationLebanonLesothoLiberiaLibyaLithuaniaLow & middle incomeLow incomeLower middle incomeLuxembourgMacao SAR, ChinaMacedonia, FYRMadagascarMalawiMalaysiaMaldivesMaliMaltaMauritaniaMauritiusMexicoMicronesia, Fed. Sts.Middle East & North AfricaMiddle East & North Africa (excluding high income)Middle East & North Africa (IDA & IBRD countries)Middle incomeMoldovaMongoliaMontenegroMoroccoMozambiqueNamibiaNepalNetherlandsNew CaledoniaNew ZealandNicaraguaNigerNigeriaNorth AmericaNorwayOECD membersOmanOther small statesPacific island small statesPakistanPanamaPapua New GuineaParaguayPeruPhilippinesPolandPortugalPost-demographic dividendPre-demographic dividendPuerto RicoQatarRomaniaRussian FederationRwandaSaudi ArabiaSenegalSerbiaSeychellesSierra LeoneSingaporeSlovak RepublicSloveniaSmall statesSolomon IslandsSomaliaSouth AfricaSouth AsiaSouth Asia (IDA & IBRD)South SudanSpainSri LankaSt. Kitts and NevisSt. LuciaSt. Vincent and the GrenadinesSub-Saharan Africa Sub-Saharan Africa (excluding high income)Sub-Saharan Africa (IDA & IBRD countries)SudanSurinameSwazilandSwedenSwitzerlandSyrian Arab RepublicTajikistanTanzaniaThailandTimor-LesteTogoTongaTrinidad and TobagoTunisiaTurkeyTurkmenistanUgandaUkraineUnited Arab EmiratesUnited KingdomUnited StatesUpper middle incomeUruguayUzbekistanVanuatuVenezuela, RBVietnamWest Bank and GazaWorldYemen, Rep.ZambiaZimbabwe Zeitlinie:
Diese Zeitleiste vorliegt die Graphik ab 1971 J. bis 2016 J. Austria. Die Angaben bis 1970 J. sind nicht vorhanden. Die Zahl aktueller Beobachtungen nach Daten: 46.
Die Quelle (Bezeichnung):
Kennzahlen der Weltentwicklung
Die Quelle (Einrichtung):
World Bank national accounts data, and OECD National Accounts data files.
Kategorien:
Economy & Growth
Es wurde aktualisiert:
23 Apr 2017 Jahr
Kennzahlen der Wertänderungen vom Jahr zum Jahr
Minimum:
22.654
1 Jan 2011 Jahr
Maximum:
32.689
1 Jan 1975 Jahr
Zum Datum der Beobachtung
Wert
Absolute Veränderung
Die Veränderung bezüglich dem vorherigen Wert
1 Jan 1971 Jahr
31.196
+31.196
0.0%
1 Jan 1972 Jahr
31.189
-0.007
-0.02%
1 Jan 1973 Jahr
32.161
+0.972
3.12%
1 Jan 1974 Jahr
32.408
+0.247
0.77%
1 Jan 1975 Jahr
32.689
+0.281
0.87%
1 Jan 1976 Jahr
27.297
-5.393
-16.5%
1 Jan 1977 Jahr
28.657
+1.36
4.98%
1 Jan 1978 Jahr
29.852
+1.196
4.17%
1 Jan 1979 Jahr
26.663
-3.19
-10.68%
1 Jan 1980 Jahr
29.494
+2.831
10.62%
1 Jan 1981 Jahr
28.927
-0.567
-1.92%
1 Jan 1982 Jahr
27.063
-1.864
-6.44%
1 Jan 1983 Jahr
24.705
-2.358
-8.71%
1 Jan 1984 Jahr
23.16
-1.546
-6.26%
1 Jan 1985 Jahr
23.896
+0.736
3.18%
1 Jan 1986 Jahr
24.574
+0.678
2.84%
1 Jan 1987 Jahr
23.854
-0.719
-2.93%
1 Jan 1988 Jahr
24.18
+0.325
1.36%
1 Jan 1989 Jahr
25.734
+1.554
6.43%
1 Jan 1990 Jahr
26.605
+0.871
3.38%
1 Jan 1991 Jahr
26.825
+0.22
0.83%
1 Jan 1992 Jahr
27.034
+0.209
0.78%
1 Jan 1993 Jahr
26.336
-0.698
-2.58%
1 Jan 1994 Jahr
25.374
-0.961
-3.65%
1 Jan 1995 Jahr
26.215
+0.84
3.31%
1 Jan 1996 Jahr
26.899
+0.685
2.61%
1 Jan 1997 Jahr
26.481
-0.418
-1.55%
1 Jan 1998 Jahr
26.323
-0.158
-0.6%
1 Jan 1999 Jahr
26.225
-0.098
-0.37%
1 Jan 2000 Jahr
26.202
-0.023
-0.09%
1 Jan 2001 Jahr
26.009
-0.193
-0.73%
1 Jan 2002 Jahr
25.206
-0.803
-3.09%
1 Jan 2003 Jahr
23.667
-1.539
-6.1%
1 Jan 2004 Jahr
24.472
+0.805
3.4%
1 Jan 2005 Jahr
24.111
-0.361
-1.47%
1 Jan 2006 Jahr
23.886
-0.226
-0.94%
1 Jan 2007 Jahr
23.67
-0.215
-0.9%
1 Jan 2008 Jahr
24.62
+0.95
4.01%
1 Jan 2009 Jahr
24.535
-0.085
-0.34%
1 Jan 2010 Jahr
22.845
-1.691
-6.89%
1 Jan 2011 Jahr
22.654
-0.191
-0.84%
1 Jan 2012 Jahr
24.175
+1.522
6.72%
1 Jan 2013 Jahr
24.02
-0.155
-0.64%
1 Jan 2014 Jahr
23.835
-0.185
-0.77%
1 Jan 2015 Jahr
23.656
-0.179
-0.75%
1 Jan 2016 Jahr
23.507
-0.149
-0.63%
Bewertung der Länder gemäß mit laufender Statistik nach Jahren


Kommentare: