29
/de/
de
AIzaSyAYiBZKx7MnpbEhh9jyipgxe19OcubqV5w
April 1, 2024
101128
Canada
CAN
true
2
1
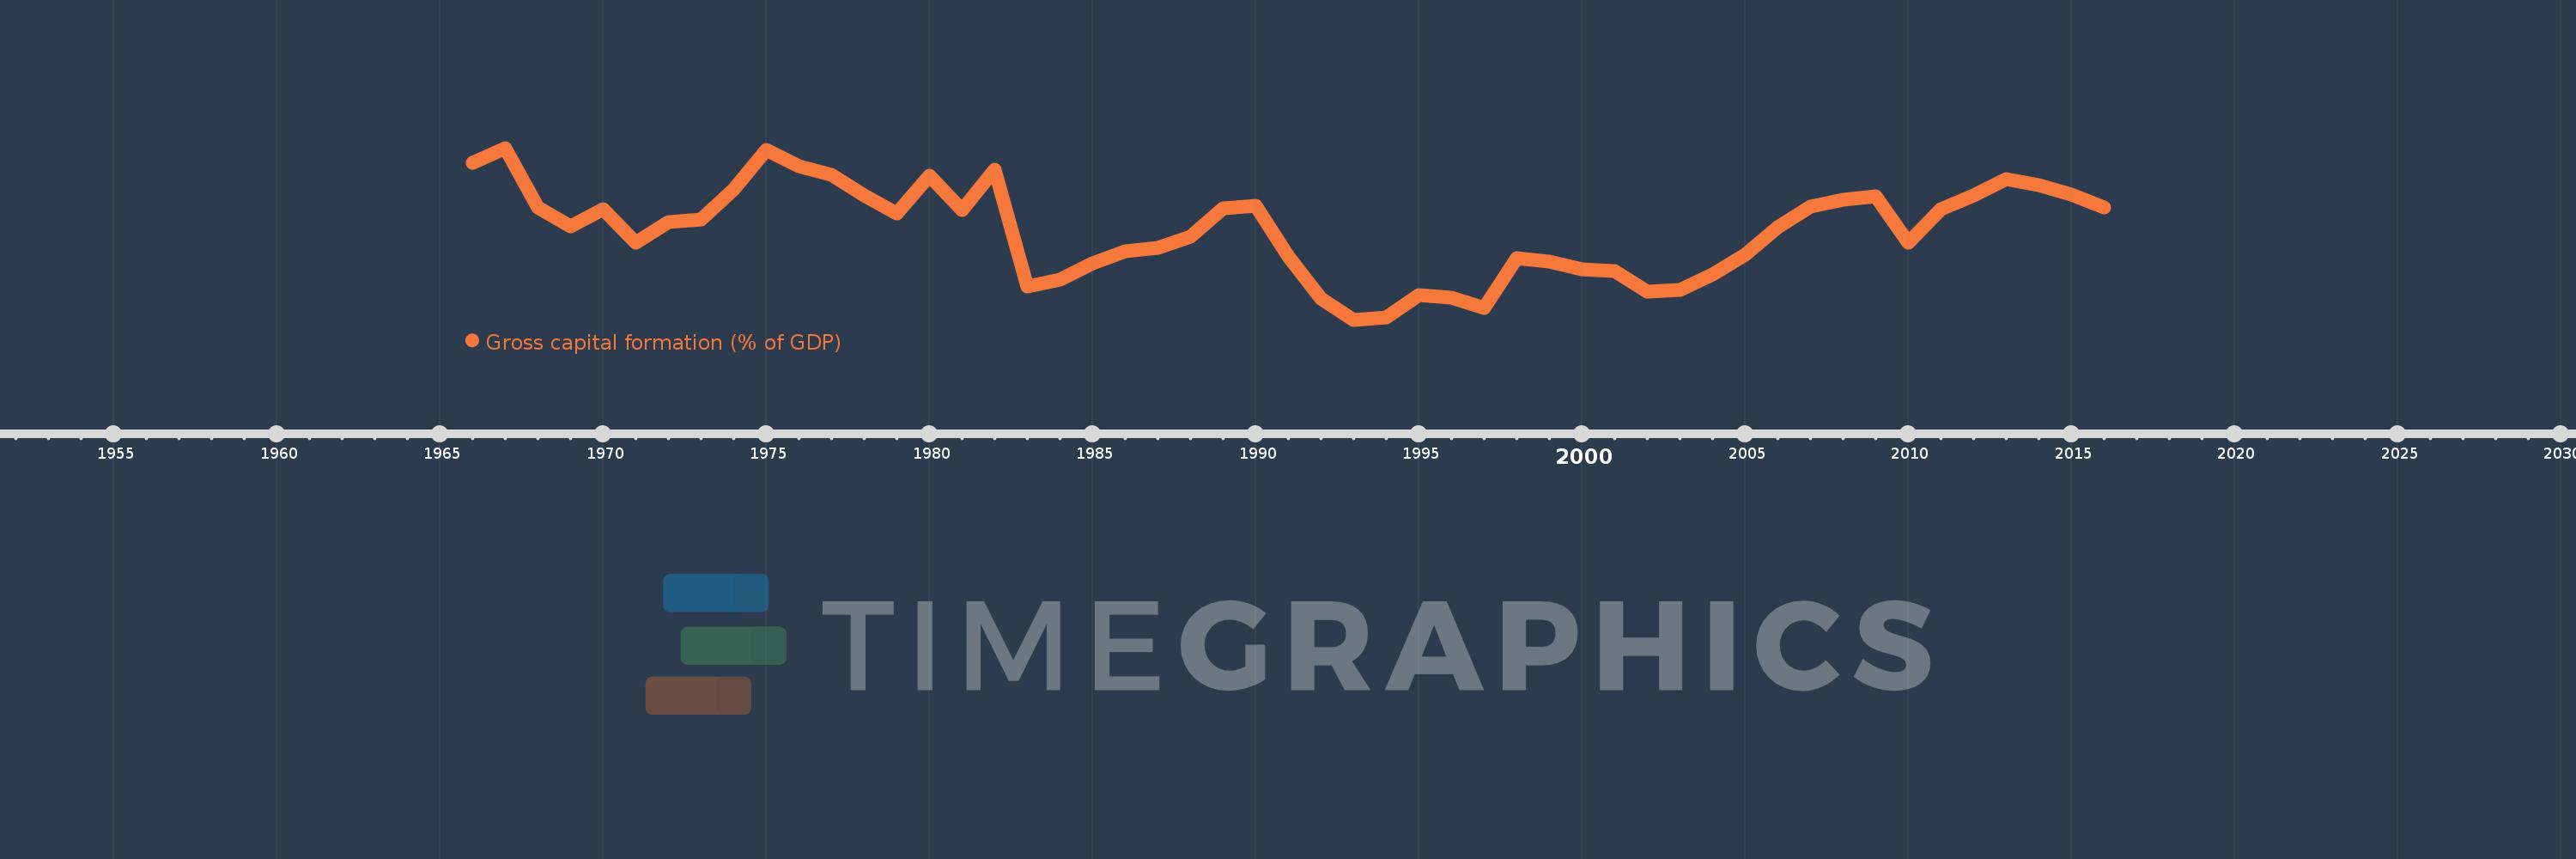
Gross capital formation (% of GDP)
2016,2015,2014,2013,2012,2011,2010,2009,2008,2007,2006,2005,2004,2003,2002,2001,2000,1999,1998,1997,1996,1995,1994,1993,1992,1991,1990,1989,1988,1987,1986,1985,1984,1983,1982,1981,1980,1979,1978,1977,1976,1975,1974,1973,1972,1971,1970,1969,1968,1967,1966
Diese Statistik in anderen Ländern:
AfghanistanAlbaniaAlgeriaAngolaAntigua and BarbudaArab WorldArgentinaArmeniaArubaAustraliaAustriaAzerbaijanBahamas, TheBahrainBangladeshBarbadosBelarusBelgiumBelizeBeninBermudaBhutanBoliviaBosnia and HerzegovinaBotswanaBrazilBrunei DarussalamBulgariaBurkina FasoBurundiCabo VerdeCambodiaCameroonCanadaCaribbean small statesCentral African RepublicCentral Europe and the BalticsChadChileChinaColombiaComorosCongo, Dem. Rep.Congo, Rep.Costa RicaCote d'IvoireCroatiaCubaCyprusCzech RepublicDenmarkDjiboutiDominicaDominican RepublicEarly-demographic dividendEast Asia & PacificEast Asia & Pacific (excluding high income)East Asia & Pacific (IDA & IBRD countries)EcuadorEgypt, Arab Rep.El SalvadorEquatorial GuineaEritreaEstoniaEthiopiaEuro areaEurope & Central AsiaEurope & Central Asia (excluding high income)Europe & Central Asia (IDA & IBRD countries)European UnionFaroe IslandsFijiFinlandFragile and conflict affected situationsFranceGabonGambia, TheGeorgiaGermanyGhanaGreeceGrenadaGuatemalaGuineaGuinea-BissauGuyanaHaitiHeavily indebted poor countries (HIPC)High incomeHondurasHong Kong SAR, ChinaHungaryIBRD onlyIcelandIDA & IBRD totalIDA blendIDA onlyIDA totalIndiaIndonesiaIran, Islamic Rep.IraqIrelandIsraelItalyJamaicaJapanJordanKazakhstanKenyaKiribatiKorea, Rep.KosovoKuwaitKyrgyz RepublicLao PDRLate-demographic dividendLatin America & Caribbean Latin America & Caribbean (excluding high income)Latin America & the Caribbean (IDA & IBRD countries)LatviaLeast developed countries: UN classificationLebanonLesothoLiberiaLibyaLithuaniaLow & middle incomeLow incomeLower middle incomeLuxembourgMacao SAR, ChinaMacedonia, FYRMadagascarMalawiMalaysiaMaldivesMaliMaltaMauritaniaMauritiusMexicoMicronesia, Fed. Sts.Middle East & North AfricaMiddle East & North Africa (excluding high income)Middle East & North Africa (IDA & IBRD countries)Middle incomeMoldovaMongoliaMontenegroMoroccoMozambiqueNamibiaNepalNetherlandsNew CaledoniaNew ZealandNicaraguaNigerNigeriaNorth AmericaNorwayOECD membersOmanOther small statesPacific island small statesPakistanPanamaPapua New GuineaParaguayPeruPhilippinesPolandPortugalPost-demographic dividendPre-demographic dividendPuerto RicoQatarRomaniaRussian FederationRwandaSaudi ArabiaSenegalSerbiaSeychellesSierra LeoneSingaporeSlovak RepublicSloveniaSmall statesSolomon IslandsSomaliaSouth AfricaSouth AsiaSouth Asia (IDA & IBRD)South SudanSpainSri LankaSt. Kitts and NevisSt. LuciaSt. Vincent and the GrenadinesSub-Saharan Africa Sub-Saharan Africa (excluding high income)Sub-Saharan Africa (IDA & IBRD countries)SudanSurinameSwazilandSwedenSwitzerlandSyrian Arab RepublicTajikistanTanzaniaThailandTimor-LesteTogoTongaTrinidad and TobagoTunisiaTurkeyTurkmenistanUgandaUkraineUnited Arab EmiratesUnited KingdomUnited StatesUpper middle incomeUruguayUzbekistanVanuatuVenezuela, RBVietnamWest Bank and GazaWorldYemen, Rep.ZambiaZimbabwe Zeitlinie:
Diese Zeitleiste vorliegt die Graphik ab 1966 J. bis 2016 J. Canada. Die Angaben bis 1965 J. sind nicht vorhanden. Die Zahl aktueller Beobachtungen nach Daten: 51.
Die Quelle (Bezeichnung):
Kennzahlen der Weltentwicklung
Die Quelle (Einrichtung):
World Bank national accounts data, and OECD National Accounts data files.
Kategorien:
Economy & Growth
Es wurde aktualisiert:
23 Apr 2017 Jahr
Kennzahlen der Wertänderungen vom Jahr zum Jahr
Minimum:
18.439
1 Jan 1993 Jahr
Maximum:
26.387
1 Jan 1967 Jahr
Zum Datum der Beobachtung
Wert
Absolute Veränderung
Die Veränderung bezüglich dem vorherigen Wert
1 Jan 1966 Jahr
25.7
+25.7
0.0%
1 Jan 1967 Jahr
26.387
+0.687
2.67%
1 Jan 1968 Jahr
23.622
-2.764
-10.48%
1 Jan 1969 Jahr
22.757
-0.865
-3.66%
1 Jan 1970 Jahr
23.561
+0.804
3.53%
1 Jan 1971 Jahr
22.014
-1.547
-6.57%
1 Jan 1972 Jahr
22.97
+0.957
4.35%
1 Jan 1973 Jahr
23.087
+0.117
0.51%
1 Jan 1974 Jahr
24.467
+1.38
5.98%
1 Jan 1975 Jahr
26.303
+1.836
7.51%
1 Jan 1976 Jahr
25.549
-0.754
-2.87%
1 Jan 1977 Jahr
25.148
-0.401
-1.57%
1 Jan 1978 Jahr
24.192
-0.956
-3.8%
1 Jan 1979 Jahr
23.363
-0.829
-3.43%
1 Jan 1980 Jahr
25.109
+1.746
7.47%
1 Jan 1981 Jahr
23.512
-1.597
-6.36%
1 Jan 1982 Jahr
25.381
+1.87
7.95%
1 Jan 1983 Jahr
19.996
-5.385
-21.22%
1 Jan 1984 Jahr
20.3
+0.303
1.52%
1 Jan 1985 Jahr
21.04
+0.74
3.65%
1 Jan 1986 Jahr
21.618
+0.578
2.75%
1 Jan 1987 Jahr
21.77
+0.152
0.7%
1 Jan 1988 Jahr
22.271
+0.501
2.3%
1 Jan 1989 Jahr
23.6
+1.329
5.97%
1 Jan 1990 Jahr
23.7
+0.1
0.42%
1 Jan 1991 Jahr
21.381
-2.319
-9.78%
1 Jan 1992 Jahr
19.411
-1.97
-9.21%
1 Jan 1993 Jahr
18.439
-0.972
-5.01%
1 Jan 1994 Jahr
18.535
+0.096
0.52%
1 Jan 1995 Jahr
19.577
+1.042
5.62%
1 Jan 1996 Jahr
19.442
-0.135
-0.69%
1 Jan 1997 Jahr
18.99
-0.452
-2.33%
1 Jan 1998 Jahr
21.288
+2.298
12.1%
1 Jan 1999 Jahr
21.118
-0.17
-0.8%
1 Jan 2000 Jahr
20.756
-0.363
-1.72%
1 Jan 2001 Jahr
20.683
-0.072
-0.35%
1 Jan 2002 Jahr
19.741
-0.942
-4.56%
1 Jan 2003 Jahr
19.81
+0.069
0.35%
1 Jan 2004 Jahr
20.539
+0.73
3.68%
1 Jan 2005 Jahr
21.456
+0.917
4.46%
1 Jan 2006 Jahr
22.705
+1.249
5.82%
1 Jan 2007 Jahr
23.665
+0.96
4.23%
1 Jan 2008 Jahr
23.971
+0.306
1.29%
1 Jan 2009 Jahr
24.132
+0.162
0.68%
1 Jan 2010 Jahr
22.015
-2.117
-8.77%
1 Jan 2011 Jahr
23.537
+1.522
6.91%
1 Jan 2012 Jahr
24.208
+0.671
2.85%
1 Jan 2013 Jahr
24.928
+0.72
2.97%
1 Jan 2014 Jahr
24.647
-0.28
-1.12%
1 Jan 2015 Jahr
24.238
-0.409
-1.66%
1 Jan 2016 Jahr
23.63
-0.608
-2.51%
Bewertung der Länder gemäß mit laufender Statistik nach Jahren


Kommentare: