29
/de/
de
AIzaSyAYiBZKx7MnpbEhh9jyipgxe19OcubqV5w
April 1, 2024
73305
Australia
AUS
true
2
1
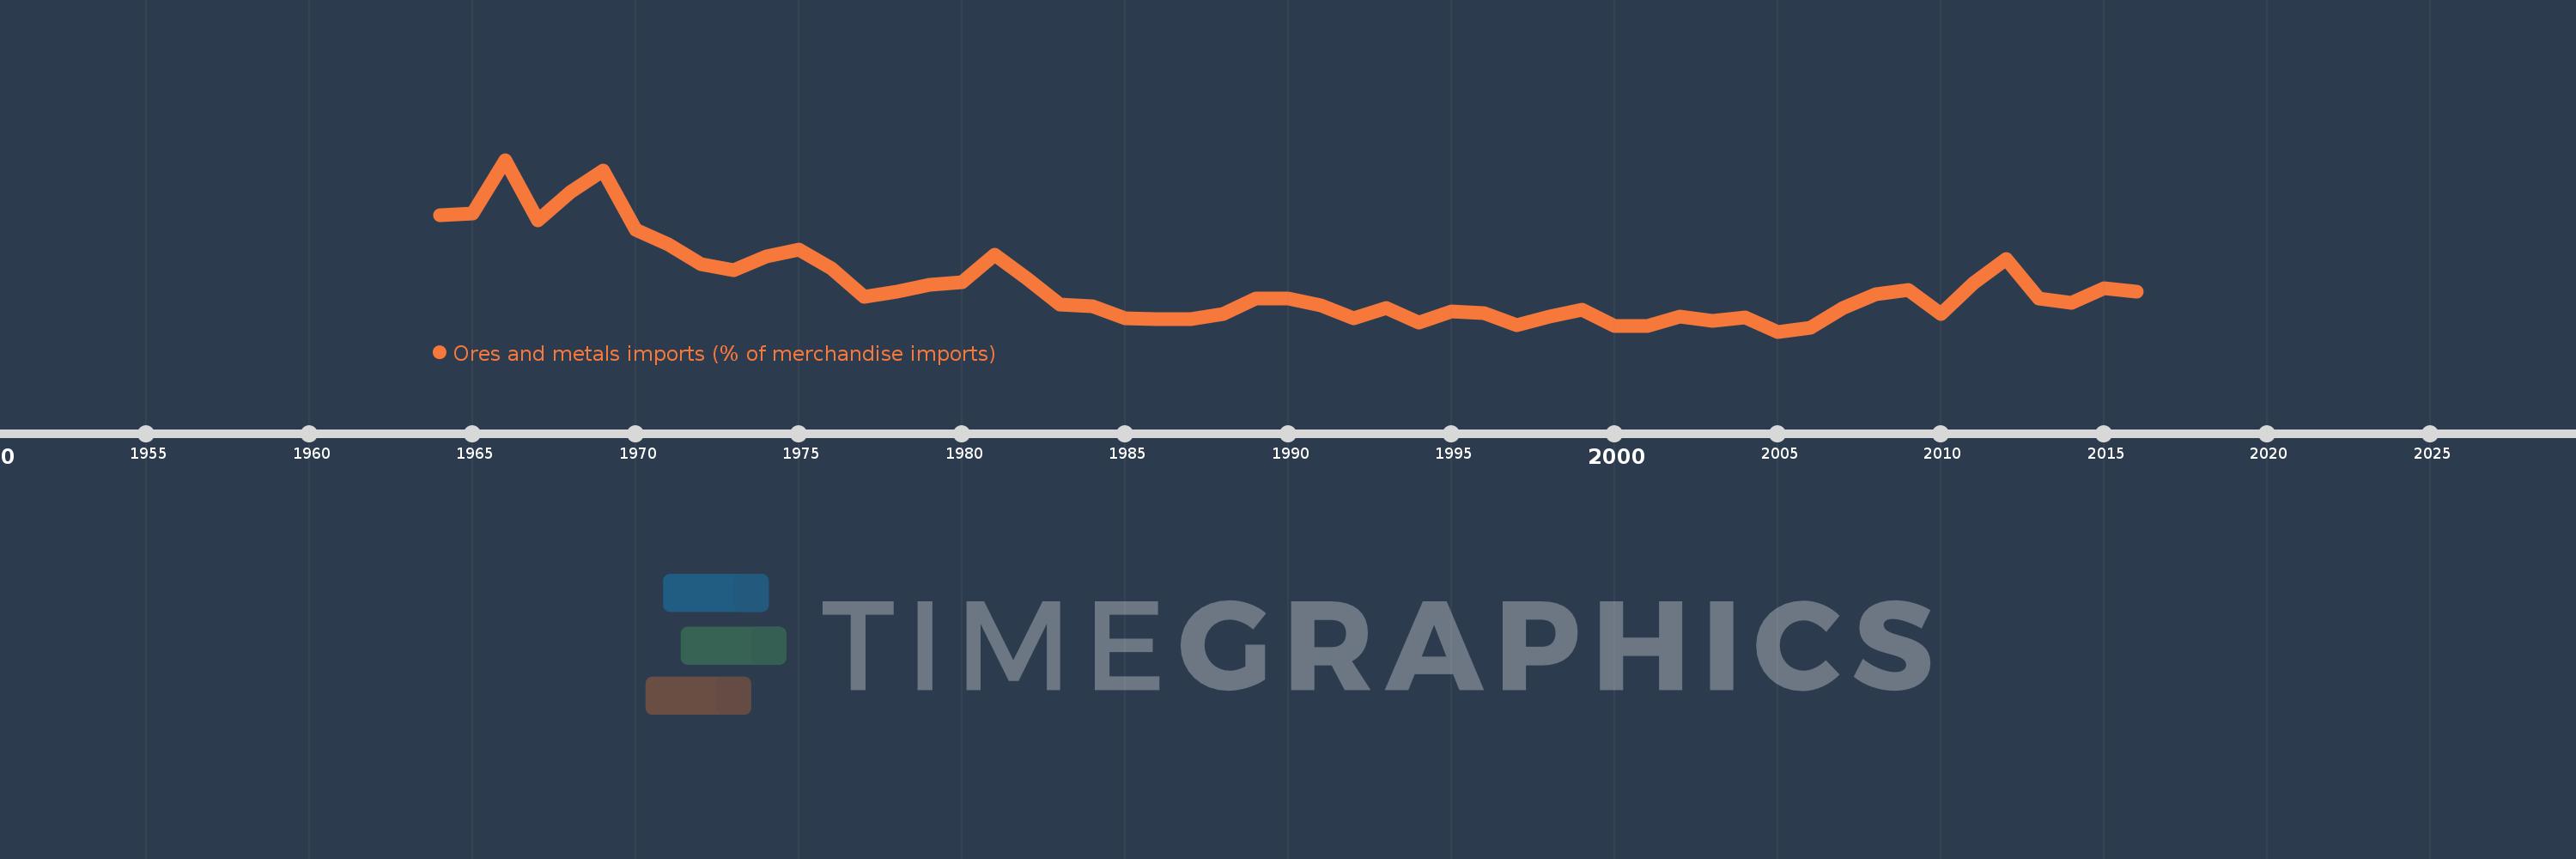
Ores and metals imports (% of merchandise imports)
2016,2015,2014,2013,2012,2011,2010,2009,2008,2007,2006,2005,2004,2003,2002,2001,2000,1999,1998,1997,1996,1995,1994,1993,1992,1991,1990,1989,1988,1987,1986,1985,1984,1983,1982,1981,1980,1979,1978,1977,1976,1975,1974,1973,1972,1971,1970,1969,1968,1967,1966,1965,1964
Diese Statistik in anderen Ländern:
AfghanistanAlbaniaAlgeriaAndorraAngolaAntigua and BarbudaArab WorldArgentinaArmeniaArubaAustraliaAustriaAzerbaijanBahamas, TheBahrainBangladeshBarbadosBelarusBelgiumBelizeBeninBermudaBhutanBoliviaBosnia and HerzegovinaBotswanaBrazilBrunei DarussalamBulgariaBurkina FasoBurundiCabo VerdeCambodiaCameroonCanadaCaribbean small statesCayman IslandsCentral African RepublicCentral Europe and the BalticsChadChileChinaColombiaComorosCongo, Dem. Rep.Congo, Rep.Costa RicaCote d'IvoireCroatiaCubaCyprusCzech RepublicDenmarkDjiboutiDominicaDominican RepublicEarly-demographic dividendEast Asia & PacificEast Asia & Pacific (excluding high income)East Asia & Pacific (IDA & IBRD countries)EcuadorEgypt, Arab Rep.El SalvadorEquatorial GuineaEritreaEstoniaEthiopiaEuro areaEurope & Central AsiaEurope & Central Asia (excluding high income)Europe & Central Asia (IDA & IBRD countries)European UnionFaroe IslandsFijiFinlandFragile and conflict affected situationsFranceFrench PolynesiaGabonGambia, TheGeorgiaGermanyGhanaGreeceGreenlandGrenadaGuatemalaGuineaGuinea-BissauGuyanaHaitiHeavily indebted poor countries (HIPC)High incomeHondurasHong Kong SAR, ChinaHungaryIBRD onlyIcelandIDA & IBRD totalIDA blendIDA onlyIDA totalIndiaIndonesiaIran, Islamic Rep.IraqIrelandIsraelItalyJamaicaJapanJordanKazakhstanKenyaKiribatiKorea, Rep.KuwaitKyrgyz RepublicLao PDRLate-demographic dividendLatin America & Caribbean Latin America & Caribbean (excluding high income)Latin America & the Caribbean (IDA & IBRD countries)LatviaLeast developed countries: UN classificationLebanonLesothoLiberiaLibyaLithuaniaLow & middle incomeLow incomeLower middle incomeLuxembourgMacao SAR, ChinaMacedonia, FYRMadagascarMalawiMalaysiaMaldivesMaliMaltaMauritaniaMauritiusMexicoMiddle East & North AfricaMiddle East & North Africa (excluding high income)Middle East & North Africa (IDA & IBRD countries)Middle incomeMoldovaMongoliaMoroccoMozambiqueMyanmarNamibiaNepalNetherlandsNew CaledoniaNew ZealandNicaraguaNigerNigeriaNorth AmericaNorwayOECD membersOmanOther small statesPacific island small statesPakistanPalauPanamaPapua New GuineaParaguayPeruPhilippinesPolandPortugalPost-demographic dividendPre-demographic dividendQatarRomaniaRussian FederationRwandaSamoaSao Tome and PrincipeSaudi ArabiaSenegalSerbiaSeychellesSierra LeoneSingaporeSlovak RepublicSloveniaSmall statesSolomon IslandsSomaliaSouth AfricaSouth AsiaSouth Asia (IDA & IBRD)SpainSri LankaSt. Kitts and NevisSt. LuciaSt. Vincent and the GrenadinesSub-Saharan Africa Sub-Saharan Africa (excluding high income)Sub-Saharan Africa (IDA & IBRD countries)SudanSurinameSwazilandSwedenSwitzerlandSyrian Arab RepublicTajikistanTanzaniaThailandTimor-LesteTogoTongaTrinidad and TobagoTunisiaTurkeyTurkmenistanTurks and Caicos IslandsTuvaluUgandaUkraineUnited Arab EmiratesUnited KingdomUnited StatesUpper middle incomeUruguayVanuatuVenezuela, RBVietnamVirgin Islands (U.S.)WorldYemen, Rep.ZambiaZimbabwe Zeitlinie:
Diese Zeitleiste vorliegt die Graphik ab 1964 J. bis 2016 J. Australia. Die Angaben bis 1963 J. sind nicht vorhanden. Die Zahl aktueller Beobachtungen nach Daten: 53.
Die Quelle (Bezeichnung):
Kennzahlen der Weltentwicklung
Die Quelle (Einrichtung):
World Bank staff estimates from the Comtrade database maintained by the United Nations Statistics Division.
Kategorien:
Energy & Mining, Private Sector, Trade
Es wurde aktualisiert:
23 Apr 2017 Jahr
Kennzahlen der Wertänderungen vom Jahr zum Jahr
Minimum:
1.088
1 Jan 2005 Jahr
Maximum:
3.436
1 Jan 1966 Jahr
Zum Datum der Beobachtung
Wert
Absolute Veränderung
Die Veränderung bezüglich dem vorherigen Wert
1 Jan 1964 Jahr
2.682
+2.682
0.0%
1 Jan 1965 Jahr
2.702
+0.02
0.76%
1 Jan 1966 Jahr
3.436
+0.734
27.16%
1 Jan 1967 Jahr
2.607
-0.829
-24.14%
1 Jan 1968 Jahr
2.997
+0.391
14.99%
1 Jan 1969 Jahr
3.288
+0.29
9.69%
1 Jan 1970 Jahr
2.485
-0.802
-24.4%
1 Jan 1971 Jahr
2.279
-0.206
-8.29%
1 Jan 1972 Jahr
2.006
-0.274
-12.02%
1 Jan 1973 Jahr
1.933
-0.072
-3.6%
1 Jan 1974 Jahr
2.114
+0.18
9.33%
1 Jan 1975 Jahr
2.205
+0.091
4.32%
1 Jan 1976 Jahr
1.951
-0.254
-11.51%
1 Jan 1977 Jahr
1.566
-0.385
-19.74%
1 Jan 1978 Jahr
1.636
+0.07
4.48%
1 Jan 1979 Jahr
1.723
+0.086
5.28%
1 Jan 1980 Jahr
1.768
+0.046
2.65%
1 Jan 1981 Jahr
2.14
+0.372
21.04%
1 Jan 1982 Jahr
1.805
-0.335
-15.65%
1 Jan 1983 Jahr
1.457
-0.349
-19.31%
1 Jan 1984 Jahr
1.436
-0.02
-1.4%
1 Jan 1985 Jahr
1.269
-0.167
-11.64%
1 Jan 1986 Jahr
1.26
-0.009
-0.72%
1 Jan 1987 Jahr
1.262
+0.002
0.18%
1 Jan 1988 Jahr
1.326
+0.064
5.1%
1 Jan 1989 Jahr
1.545
+0.218
16.46%
1 Jan 1990 Jahr
1.54
-0.004
-0.28%
1 Jan 1991 Jahr
1.444
-0.097
-6.27%
1 Jan 1992 Jahr
1.265
-0.179
-12.39%
1 Jan 1993 Jahr
1.409
+0.144
11.37%
1 Jan 1994 Jahr
1.21
-0.199
-14.09%
1 Jan 1995 Jahr
1.367
+0.157
12.97%
1 Jan 1996 Jahr
1.346
-0.021
-1.54%
1 Jan 1997 Jahr
1.18
-0.166
-12.3%
1 Jan 1998 Jahr
1.296
+0.115
9.74%
1 Jan 1999 Jahr
1.384
+0.089
6.85%
1 Jan 2000 Jahr
1.167
-0.217
-15.69%
1 Jan 2001 Jahr
1.17
+0.003
0.23%
1 Jan 2002 Jahr
1.288
+0.118
10.12%
1 Jan 2003 Jahr
1.232
-0.056
-4.33%
1 Jan 2004 Jahr
1.285
+0.052
4.25%
1 Jan 2005 Jahr
1.088
-0.197
-15.32%
1 Jan 2006 Jahr
1.14
+0.052
4.78%
1 Jan 2007 Jahr
1.405
+0.266
23.31%
1 Jan 2008 Jahr
1.597
+0.191
13.62%
1 Jan 2009 Jahr
1.661
+0.064
4.04%
1 Jan 2010 Jahr
1.333
-0.328
-19.73%
1 Jan 2011 Jahr
1.746
+0.413
30.95%
1 Jan 2012 Jahr
2.078
+0.332
19.0%
1 Jan 2013 Jahr
1.539
-0.538
-25.92%
1 Jan 2014 Jahr
1.476
-0.064
-4.13%
1 Jan 2015 Jahr
1.679
+0.204
13.81%
1 Jan 2016 Jahr
1.631
-0.048
-2.87%
Bewertung der Länder gemäß mit laufender Statistik nach Jahren


Kommentare: