29
/de/
de
AIzaSyAYiBZKx7MnpbEhh9jyipgxe19OcubqV5w
April 1, 2024
281420
Venezuela, RB
VEN
true
2
1
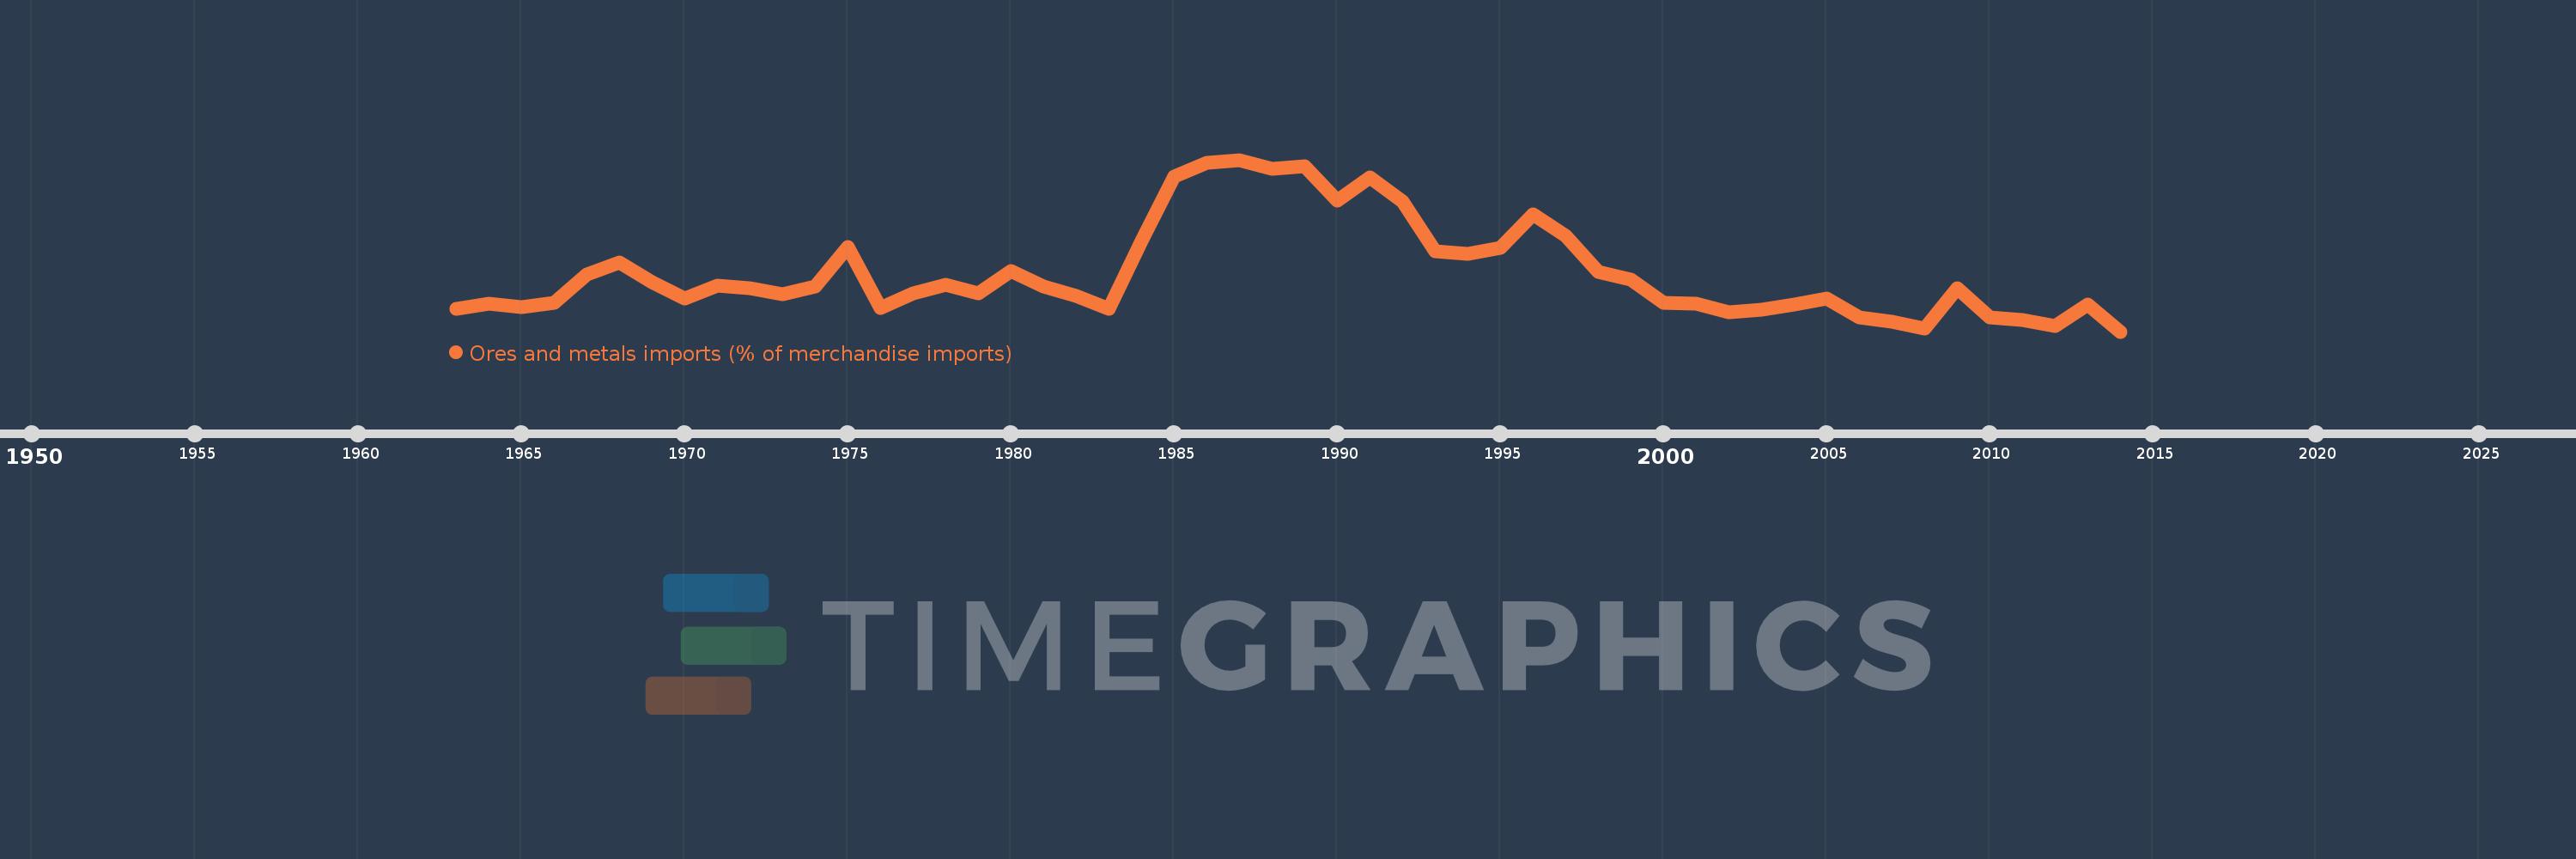
Ores and metals imports (% of merchandise imports)
2014,2013,2012,2011,2010,2009,2008,2007,2006,2005,2004,2003,2002,2001,2000,1999,1998,1997,1996,1995,1994,1993,1992,1991,1990,1989,1988,1987,1986,1985,1984,1983,1982,1981,1980,1979,1978,1977,1976,1975,1974,1973,1972,1971,1970,1969,1968,1967,1966,1965,1964,1963
Diese Statistik in anderen Ländern:
AfghanistanAlbaniaAlgeriaAndorraAngolaAntigua and BarbudaArab WorldArgentinaArmeniaArubaAustraliaAustriaAzerbaijanBahamas, TheBahrainBangladeshBarbadosBelarusBelgiumBelizeBeninBermudaBhutanBoliviaBosnia and HerzegovinaBotswanaBrazilBrunei DarussalamBulgariaBurkina FasoBurundiCabo VerdeCambodiaCameroonCanadaCaribbean small statesCayman IslandsCentral African RepublicCentral Europe and the BalticsChadChileChinaColombiaComorosCongo, Dem. Rep.Congo, Rep.Costa RicaCote d'IvoireCroatiaCubaCyprusCzech RepublicDenmarkDjiboutiDominicaDominican RepublicEarly-demographic dividendEast Asia & PacificEast Asia & Pacific (excluding high income)East Asia & Pacific (IDA & IBRD countries)EcuadorEgypt, Arab Rep.El SalvadorEquatorial GuineaEritreaEstoniaEthiopiaEuro areaEurope & Central AsiaEurope & Central Asia (excluding high income)Europe & Central Asia (IDA & IBRD countries)European UnionFaroe IslandsFijiFinlandFragile and conflict affected situationsFranceFrench PolynesiaGabonGambia, TheGeorgiaGermanyGhanaGreeceGreenlandGrenadaGuatemalaGuineaGuinea-BissauGuyanaHaitiHeavily indebted poor countries (HIPC)High incomeHondurasHong Kong SAR, ChinaHungaryIBRD onlyIcelandIDA & IBRD totalIDA blendIDA onlyIDA totalIndiaIndonesiaIran, Islamic Rep.IraqIrelandIsraelItalyJamaicaJapanJordanKazakhstanKenyaKiribatiKorea, Rep.KuwaitKyrgyz RepublicLao PDRLate-demographic dividendLatin America & Caribbean Latin America & Caribbean (excluding high income)Latin America & the Caribbean (IDA & IBRD countries)LatviaLeast developed countries: UN classificationLebanonLesothoLiberiaLibyaLithuaniaLow & middle incomeLow incomeLower middle incomeLuxembourgMacao SAR, ChinaMacedonia, FYRMadagascarMalawiMalaysiaMaldivesMaliMaltaMauritaniaMauritiusMexicoMiddle East & North AfricaMiddle East & North Africa (excluding high income)Middle East & North Africa (IDA & IBRD countries)Middle incomeMoldovaMongoliaMoroccoMozambiqueMyanmarNamibiaNepalNetherlandsNew CaledoniaNew ZealandNicaraguaNigerNigeriaNorth AmericaNorwayOECD membersOmanOther small statesPacific island small statesPakistanPalauPanamaPapua New GuineaParaguayPeruPhilippinesPolandPortugalPost-demographic dividendPre-demographic dividendQatarRomaniaRussian FederationRwandaSamoaSao Tome and PrincipeSaudi ArabiaSenegalSerbiaSeychellesSierra LeoneSingaporeSlovak RepublicSloveniaSmall statesSolomon IslandsSomaliaSouth AfricaSouth AsiaSouth Asia (IDA & IBRD)SpainSri LankaSt. Kitts and NevisSt. LuciaSt. Vincent and the GrenadinesSub-Saharan Africa Sub-Saharan Africa (excluding high income)Sub-Saharan Africa (IDA & IBRD countries)SudanSurinameSwazilandSwedenSwitzerlandSyrian Arab RepublicTajikistanTanzaniaThailandTimor-LesteTogoTongaTrinidad and TobagoTunisiaTurkeyTurkmenistanTurks and Caicos IslandsTuvaluUgandaUkraineUnited Arab EmiratesUnited KingdomUnited StatesUpper middle incomeUruguayVanuatuVenezuela, RBVietnamVirgin Islands (U.S.)WorldYemen, Rep.ZambiaZimbabwe Zeitlinie:
Diese Zeitleiste vorliegt die Graphik ab 1963 J. bis 2014 J. Venezuela, RB. Die Angaben bis 1962 J. sind nicht vorhanden. Die Zahl aktueller Beobachtungen nach Daten: 52.
Die Quelle (Bezeichnung):
Kennzahlen der Weltentwicklung
Die Quelle (Einrichtung):
World Bank staff estimates from the Comtrade database maintained by the United Nations Statistics Division.
Kategorien:
Energy & Mining, Private Sector, Trade
Es wurde aktualisiert:
23 Apr 2017 Jahr
Kennzahlen der Wertänderungen vom Jahr zum Jahr
Minimum:
1.151
1 Jan 2014 Jahr
Maximum:
4.737
1 Jan 1987 Jahr
Zum Datum der Beobachtung
Wert
Absolute Veränderung
Die Veränderung bezüglich dem vorherigen Wert
1 Jan 1963 Jahr
1.619
+1.619
0.0%
1 Jan 1964 Jahr
1.731
+0.111
6.87%
1 Jan 1965 Jahr
1.664
-0.067
-3.85%
1 Jan 1966 Jahr
1.759
+0.095
5.73%
1 Jan 1967 Jahr
2.337
+0.577
32.81%
1 Jan 1968 Jahr
2.6
+0.263
11.27%
1 Jan 1969 Jahr
2.186
-0.414
-15.91%
1 Jan 1970 Jahr
1.841
-0.345
-15.78%
1 Jan 1971 Jahr
2.112
+0.271
14.7%
1 Jan 1972 Jahr
2.064
-0.048
-2.28%
1 Jan 1973 Jahr
1.931
-0.132
-6.42%
1 Jan 1974 Jahr
2.091
+0.16
8.29%
1 Jan 1975 Jahr
2.925
+0.834
39.86%
1 Jan 1976 Jahr
1.651
-1.274
-43.57%
1 Jan 1977 Jahr
1.941
+0.29
17.58%
1 Jan 1978 Jahr
2.13
+0.189
9.76%
1 Jan 1979 Jahr
1.956
-0.174
-8.19%
1 Jan 1980 Jahr
2.413
+0.457
23.38%
1 Jan 1981 Jahr
2.093
-0.32
-13.28%
1 Jan 1982 Jahr
1.897
-0.196
-9.36%
1 Jan 1983 Jahr
1.632
-0.265
-13.97%
1 Jan 1984 Jahr
3.05
+1.419
86.93%
1 Jan 1985 Jahr
4.392
+1.342
43.98%
1 Jan 1986 Jahr
4.675
+0.283
6.45%
1 Jan 1987 Jahr
4.737
+0.062
1.33%
1 Jan 1988 Jahr
4.555
-0.182
-3.84%
1 Jan 1989 Jahr
4.604
+0.048
1.06%
1 Jan 1990 Jahr
3.881
-0.723
-15.71%
1 Jan 1991 Jahr
4.363
+0.482
12.43%
1 Jan 1992 Jahr
3.865
-0.497
-11.4%
1 Jan 1993 Jahr
2.83
-1.035
-26.78%
1 Jan 1994 Jahr
2.772
-0.059
-2.07%
1 Jan 1995 Jahr
2.907
+0.136
4.9%
1 Jan 1996 Jahr
3.607
+0.7
24.06%
1 Jan 1997 Jahr
3.153
-0.454
-12.6%
1 Jan 1998 Jahr
2.395
-0.757
-24.03%
1 Jan 1999 Jahr
2.244
-0.151
-6.3%
1 Jan 2000 Jahr
1.754
-0.49
-21.84%
1 Jan 2001 Jahr
1.73
-0.024
-1.37%
1 Jan 2002 Jahr
1.562
-0.168
-9.71%
1 Jan 2003 Jahr
1.615
+0.053
3.4%
1 Jan 2004 Jahr
1.72
+0.105
6.48%
1 Jan 2005 Jahr
1.849
+0.129
7.48%
1 Jan 2006 Jahr
1.455
-0.394
-21.31%
1 Jan 2007 Jahr
1.364
-0.09
-6.22%
1 Jan 2008 Jahr
1.213
-0.152
-11.11%
1 Jan 2009 Jahr
2.049
+0.837
68.99%
1 Jan 2010 Jahr
1.447
-0.602
-29.38%
1 Jan 2011 Jahr
1.386
-0.062
-4.26%
1 Jan 2012 Jahr
1.274
-0.111
-8.03%
1 Jan 2013 Jahr
1.721
+0.446
35.03%
1 Jan 2014 Jahr
1.151
-0.57
-33.13%
Bewertung der Länder gemäß mit laufender Statistik nach Jahren


Kommentare: