29
/de/
de
AIzaSyAYiBZKx7MnpbEhh9jyipgxe19OcubqV5w
April 1, 2024
62980
World
WLD
false
2
1
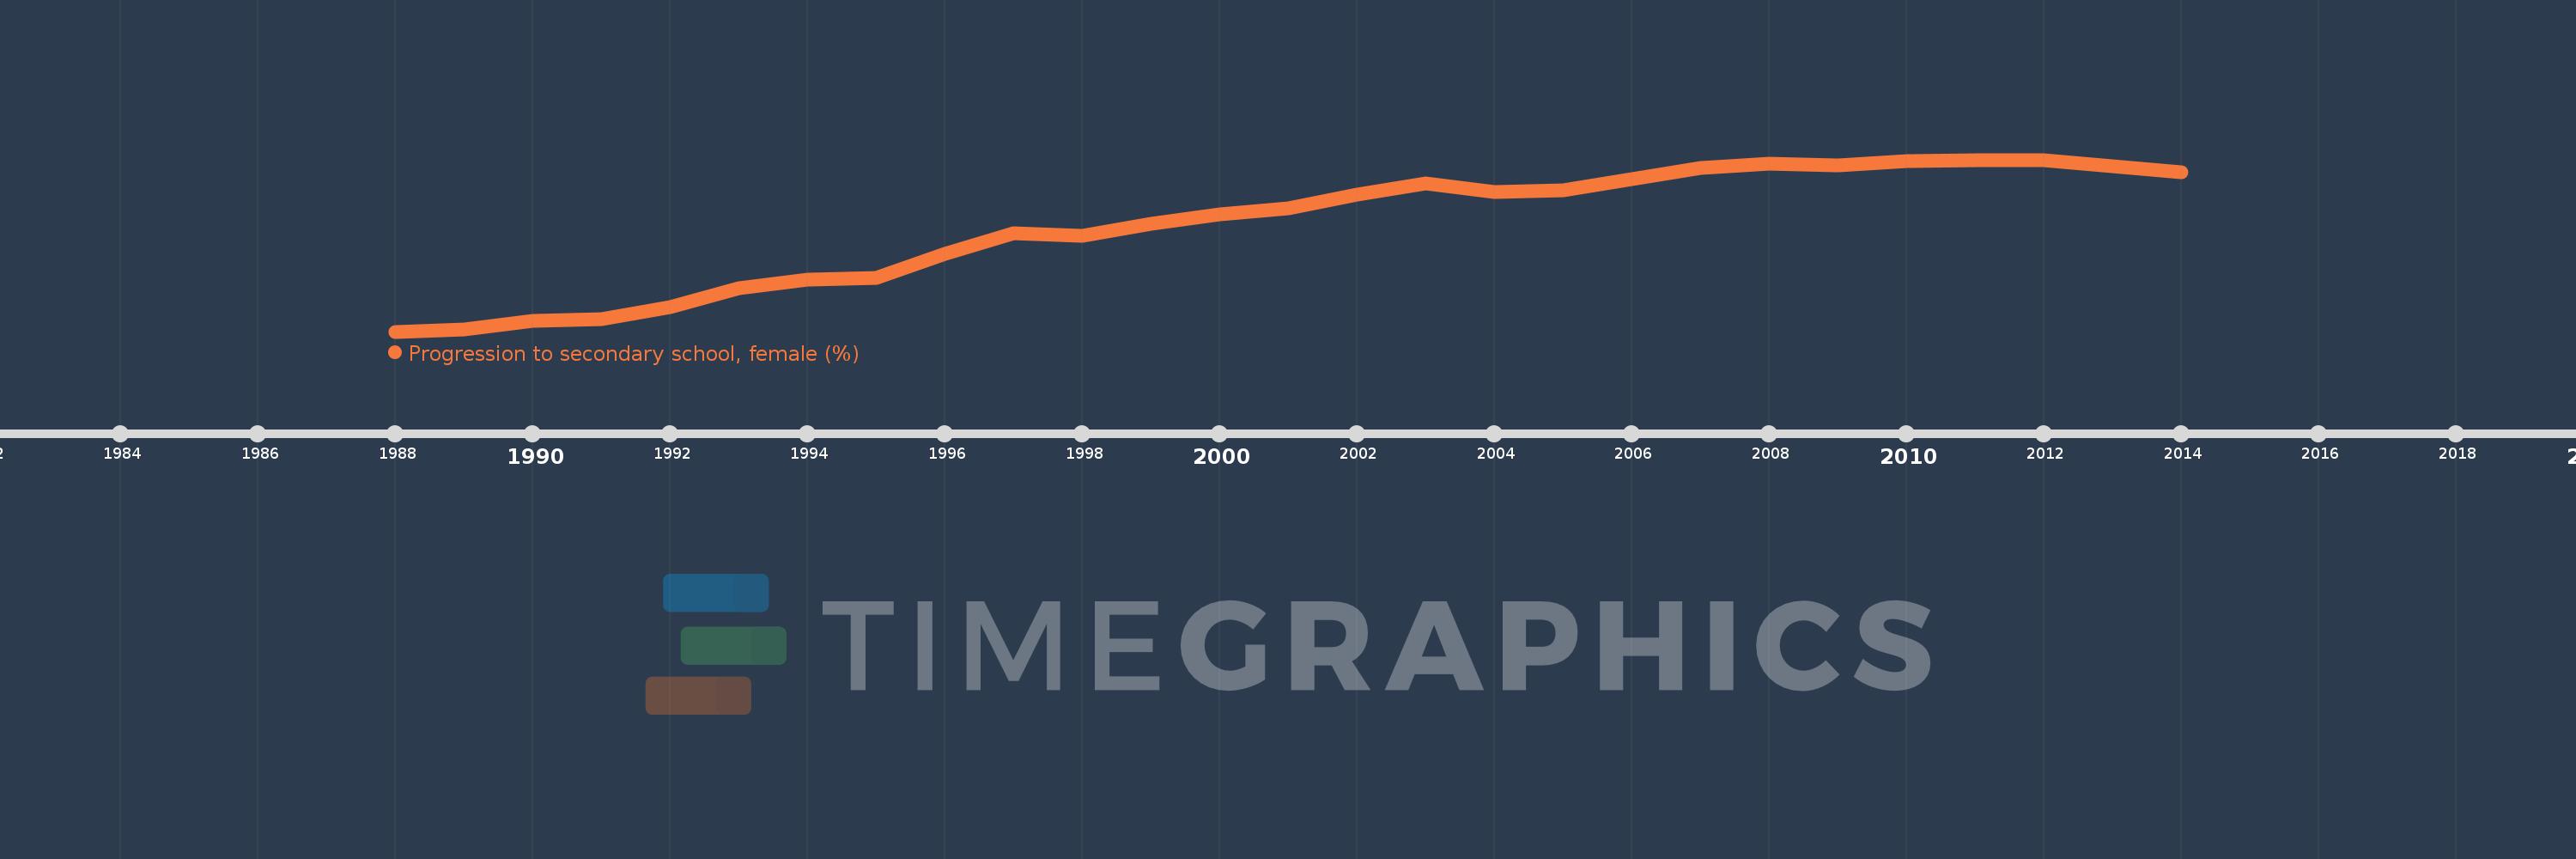
Progression to secondary school, female (%)
2014,2012,2011,2010,2009,2008,2007,2006,2005,2004,2003,2002,2001,2000,1999,1998,1997,1996,1995,1994,1993,1992,1991,1990,1989,1988
Diese Statistik in anderen Ländern:
AfghanistanAlbaniaAlgeriaAngolaAntigua and BarbudaArab WorldArgentinaArmeniaArubaAustriaAzerbaijanBahamas, TheBahrainBarbadosBelarusBelgiumBelizeBeninBermudaBhutanBoliviaBosnia and HerzegovinaBotswanaBrazilBritish Virgin IslandsBrunei DarussalamBulgariaBurkina FasoBurundiCabo VerdeCambodiaCameroonCaribbean small statesCayman IslandsCentral African RepublicCentral Europe and the BalticsChadChileChinaColombiaComorosCongo, Dem. Rep.Congo, Rep.Costa RicaCote d'IvoireCroatiaCubaCyprusCzech RepublicDenmarkDjiboutiDominicaDominican RepublicEarly-demographic dividendEast Asia & PacificEast Asia & Pacific (excluding high income)East Asia & Pacific (IDA & IBRD countries)EcuadorEgypt, Arab Rep.El SalvadorEquatorial GuineaEritreaEstoniaEthiopiaEuro areaEurope & Central AsiaEurope & Central Asia (excluding high income)Europe & Central Asia (IDA & IBRD countries)European UnionFijiFinlandFragile and conflict affected situationsGabonGambia, TheGeorgiaGermanyGhanaGreeceGrenadaGuatemalaGuineaGuinea-BissauGuyanaHaitiHeavily indebted poor countries (HIPC)High incomeHondurasHong Kong SAR, ChinaHungaryIBRD onlyIcelandIDA & IBRD totalIDA blendIDA onlyIDA totalIndiaIndonesiaIran, Islamic Rep.IraqIsraelItalyJamaicaJapanJordanKazakhstanKenyaKiribatiKorea, Rep.KuwaitKyrgyz RepublicLao PDRLate-demographic dividendLatin America & Caribbean Latin America & Caribbean (excluding high income)Latin America & the Caribbean (IDA & IBRD countries)LatviaLeast developed countries: UN classificationLebanonLesothoLiberiaLibyaLiechtensteinLithuaniaLow & middle incomeLow incomeLower middle incomeLuxembourgMacao SAR, ChinaMacedonia, FYRMadagascarMalawiMalaysiaMaldivesMaliMaltaMarshall IslandsMauritaniaMauritiusMexicoMiddle East & North AfricaMiddle East & North Africa (excluding high income)Middle East & North Africa (IDA & IBRD countries)Middle incomeMoldovaMonacoMongoliaMoroccoMozambiqueMyanmarNamibiaNepalNetherlandsNicaraguaNigerNorwayOECD membersOmanOther small statesPacific island small statesPakistanPalauPanamaParaguayPeruPhilippinesPolandPortugalPost-demographic dividendPre-demographic dividendQatarRomaniaRussian FederationRwandaSamoaSan MarinoSao Tome and PrincipeSaudi ArabiaSenegalSerbiaSeychellesSierra LeoneSingaporeSlovak RepublicSloveniaSmall statesSolomon IslandsSouth AfricaSouth AsiaSouth Asia (IDA & IBRD)SpainSri LankaSt. Kitts and NevisSt. LuciaSt. Vincent and the GrenadinesSub-Saharan Africa Sub-Saharan Africa (excluding high income)Sub-Saharan Africa (IDA & IBRD countries)SudanSurinameSwazilandSwedenSwitzerlandSyrian Arab RepublicTajikistanTanzaniaThailandTimor-LesteTogoTongaTrinidad and TobagoTunisiaTurkeyTurks and Caicos IslandsTuvaluUgandaUkraineUnited Arab EmiratesUpper middle incomeUruguayUzbekistanVanuatuVenezuela, RBVietnamWest Bank and GazaWorldYemen, Rep.ZambiaZimbabwe Zeitlinie:
Diese Zeitleiste vorliegt die Graphik ab 1988 J. bis 2014 J. World. Die Angaben bis 1987 J. sind nicht vorhanden. Die Zahl aktueller Beobachtungen nach Daten: 26.
Die Quelle (Bezeichnung):
Kennzahlen der Weltentwicklung
Die Quelle (Einrichtung):
United Nations Educational, Scientific, and Cultural Organization (UNESCO) Institute for Statistics.
Kategorien:
Education, Gender
Es wurde aktualisiert:
23 Apr 2017 Jahr
Kennzahlen der Wertänderungen vom Jahr zum Jahr
Minimum:
76.36
1 Jan 1988 Jahr
Maximum:
92.064
1 Jan 2011 Jahr
Zum Datum der Beobachtung
Wert
Absolute Veränderung
Die Veränderung bezüglich dem vorherigen Wert
1 Jan 1988 Jahr
76.36
+76.36
0.0%
1 Jan 1989 Jahr
76.577
+0.217
0.28%
1 Jan 1990 Jahr
77.345
+0.768
1.0%
1 Jan 1991 Jahr
77.497
+0.152
0.2%
1 Jan 1992 Jahr
78.57
+1.074
1.39%
1 Jan 1993 Jahr
80.29
+1.719
2.19%
1 Jan 1994 Jahr
81.076
+0.787
0.98%
1 Jan 1995 Jahr
81.243
+0.167
0.21%
1 Jan 1996 Jahr
83.477
+2.233
2.75%
1 Jan 1997 Jahr
85.342
+1.865
2.23%
1 Jan 1998 Jahr
85.079
-0.263
-0.31%
1 Jan 1999 Jahr
86.222
+1.142
1.34%
1 Jan 2000 Jahr
87.096
+0.875
1.01%
1 Jan 2001 Jahr
87.619
+0.523
0.6%
1 Jan 2002 Jahr
88.86
+1.241
1.42%
1 Jan 2003 Jahr
89.895
+1.034
1.16%
1 Jan 2004 Jahr
89.153
-0.741
-0.82%
1 Jan 2005 Jahr
89.257
+0.103
0.12%
1 Jan 2006 Jahr
90.335
+1.079
1.21%
1 Jan 2007 Jahr
91.324
+0.989
1.09%
1 Jan 2008 Jahr
91.71
+0.386
0.42%
1 Jan 2009 Jahr
91.553
-0.157
-0.17%
1 Jan 2010 Jahr
91.945
+0.391
0.43%
1 Jan 2011 Jahr
92.064
+0.119
0.13%
1 Jan 2012 Jahr
92.025
-0.039
-0.04%
1 Jan 2014 Jahr
90.944
-1.081
-1.17%
Bewertung der Länder gemäß mit laufender Statistik nach Jahren


Kommentare: