29
/de/
de
AIzaSyAYiBZKx7MnpbEhh9jyipgxe19OcubqV5w
April 1, 2024
37734
IDA & IBRD total
IBT
false
2
1
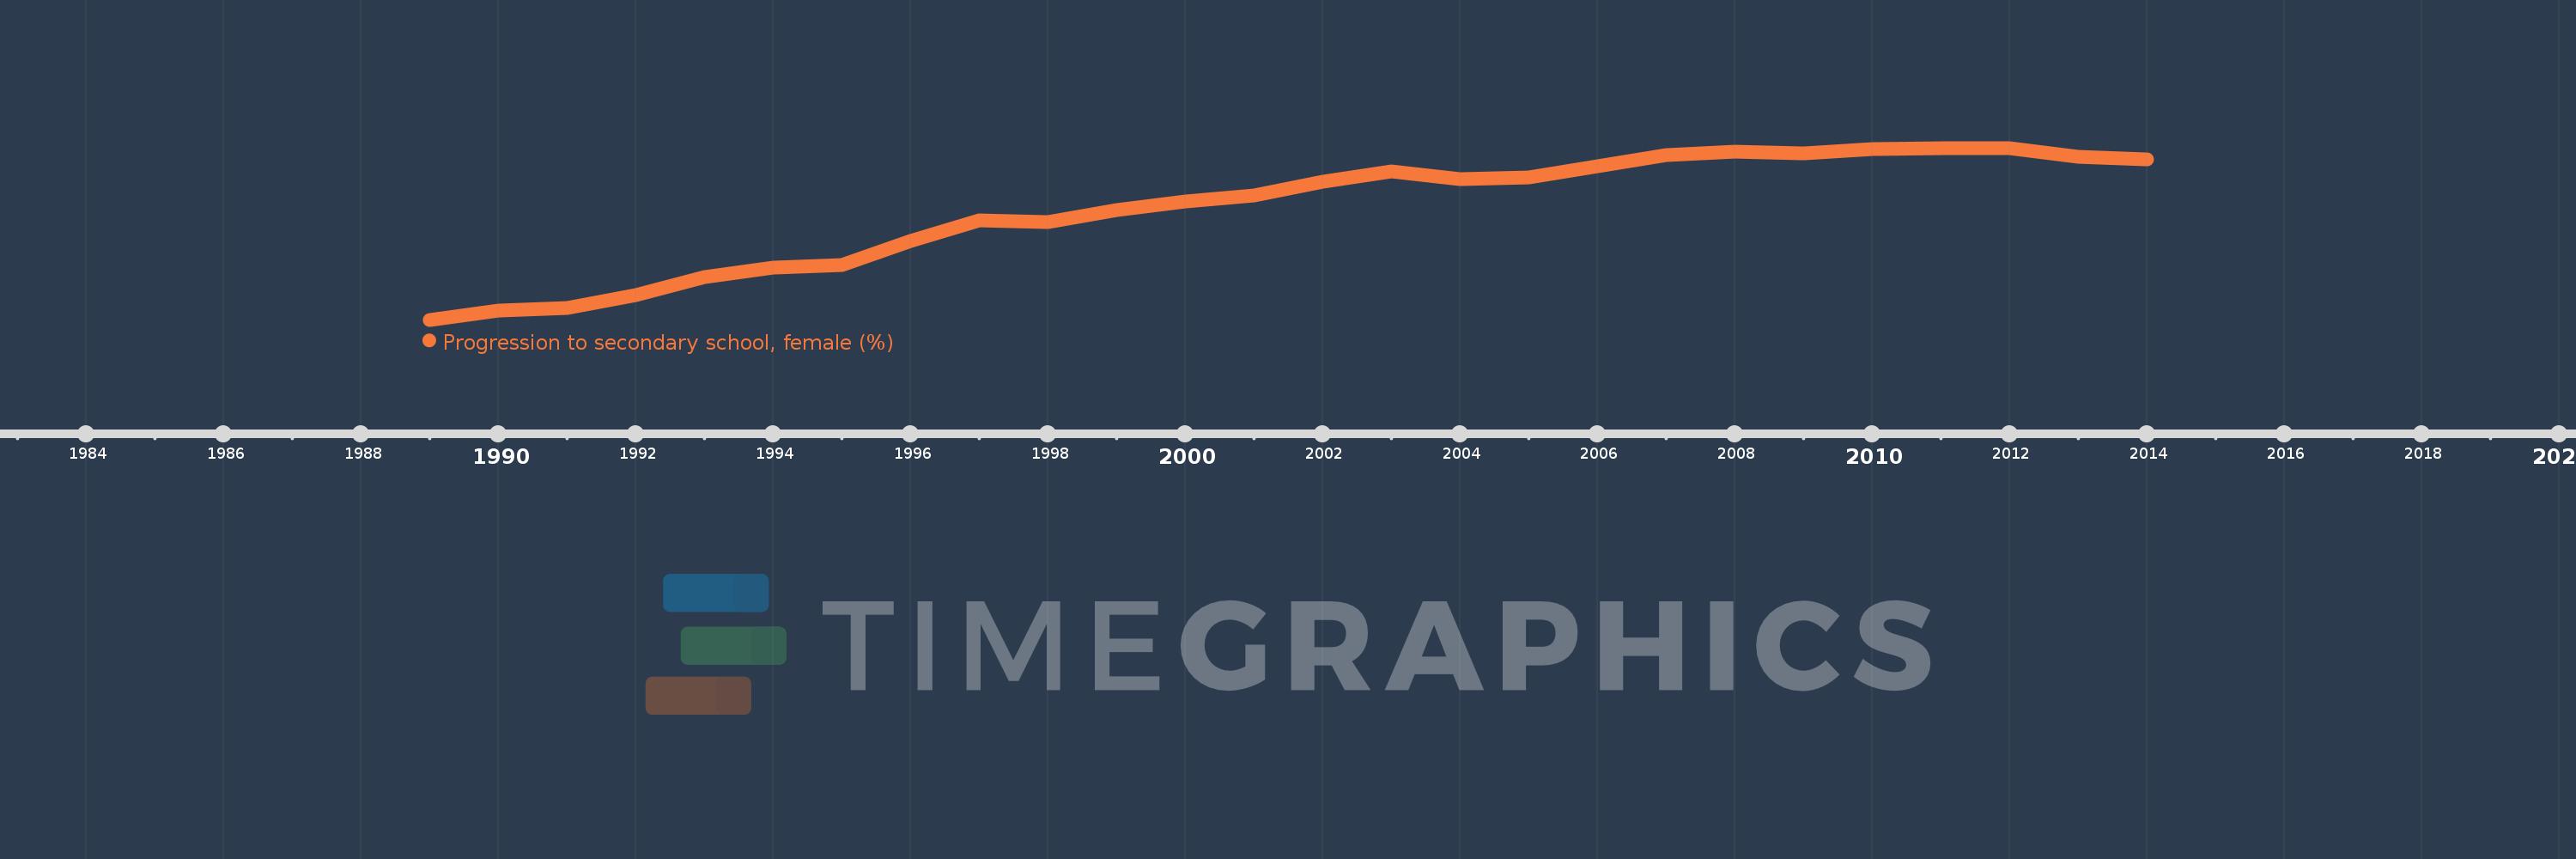
Progression to secondary school, female (%)
2014,2013,2012,2011,2010,2009,2008,2007,2006,2005,2004,2003,2002,2001,2000,1999,1998,1997,1996,1995,1994,1993,1992,1991,1990,1989
Diese Statistik in anderen Ländern:
AfghanistanAlbaniaAlgeriaAngolaAntigua and BarbudaArab WorldArgentinaArmeniaArubaAustriaAzerbaijanBahamas, TheBahrainBarbadosBelarusBelgiumBelizeBeninBermudaBhutanBoliviaBosnia and HerzegovinaBotswanaBrazilBritish Virgin IslandsBrunei DarussalamBulgariaBurkina FasoBurundiCabo VerdeCambodiaCameroonCaribbean small statesCayman IslandsCentral African RepublicCentral Europe and the BalticsChadChileChinaColombiaComorosCongo, Dem. Rep.Congo, Rep.Costa RicaCote d'IvoireCroatiaCubaCyprusCzech RepublicDenmarkDjiboutiDominicaDominican RepublicEarly-demographic dividendEast Asia & PacificEast Asia & Pacific (excluding high income)East Asia & Pacific (IDA & IBRD countries)EcuadorEgypt, Arab Rep.El SalvadorEquatorial GuineaEritreaEstoniaEthiopiaEuro areaEurope & Central AsiaEurope & Central Asia (excluding high income)Europe & Central Asia (IDA & IBRD countries)European UnionFijiFinlandFragile and conflict affected situationsGabonGambia, TheGeorgiaGermanyGhanaGreeceGrenadaGuatemalaGuineaGuinea-BissauGuyanaHaitiHeavily indebted poor countries (HIPC)High incomeHondurasHong Kong SAR, ChinaHungaryIBRD onlyIcelandIDA & IBRD totalIDA blendIDA onlyIDA totalIndiaIndonesiaIran, Islamic Rep.IraqIsraelItalyJamaicaJapanJordanKazakhstanKenyaKiribatiKorea, Rep.KuwaitKyrgyz RepublicLao PDRLate-demographic dividendLatin America & Caribbean Latin America & Caribbean (excluding high income)Latin America & the Caribbean (IDA & IBRD countries)LatviaLeast developed countries: UN classificationLebanonLesothoLiberiaLibyaLiechtensteinLithuaniaLow & middle incomeLow incomeLower middle incomeLuxembourgMacao SAR, ChinaMacedonia, FYRMadagascarMalawiMalaysiaMaldivesMaliMaltaMarshall IslandsMauritaniaMauritiusMexicoMiddle East & North AfricaMiddle East & North Africa (excluding high income)Middle East & North Africa (IDA & IBRD countries)Middle incomeMoldovaMonacoMongoliaMoroccoMozambiqueMyanmarNamibiaNepalNetherlandsNicaraguaNigerNorwayOECD membersOmanOther small statesPacific island small statesPakistanPalauPanamaParaguayPeruPhilippinesPolandPortugalPost-demographic dividendPre-demographic dividendQatarRomaniaRussian FederationRwandaSamoaSan MarinoSao Tome and PrincipeSaudi ArabiaSenegalSerbiaSeychellesSierra LeoneSingaporeSlovak RepublicSloveniaSmall statesSolomon IslandsSouth AfricaSouth AsiaSouth Asia (IDA & IBRD)SpainSri LankaSt. Kitts and NevisSt. LuciaSt. Vincent and the GrenadinesSub-Saharan Africa Sub-Saharan Africa (excluding high income)Sub-Saharan Africa (IDA & IBRD countries)SudanSurinameSwazilandSwedenSwitzerlandSyrian Arab RepublicTajikistanTanzaniaThailandTimor-LesteTogoTongaTrinidad and TobagoTunisiaTurkeyTurks and Caicos IslandsTuvaluUgandaUkraineUnited Arab EmiratesUpper middle incomeUruguayUzbekistanVanuatuVenezuela, RBVietnamWest Bank and GazaWorldYemen, Rep.ZambiaZimbabwe Zeitlinie:
Diese Zeitleiste vorliegt die Graphik ab 1989 J. bis 2014 J. IDA & IBRD total. Die Angaben bis 1988 J. sind nicht vorhanden. Die Zahl aktueller Beobachtungen nach Daten: 26.
Die Quelle (Bezeichnung):
Kennzahlen der Weltentwicklung
Die Quelle (Einrichtung):
United Nations Educational, Scientific, and Cultural Organization (UNESCO) Institute for Statistics.
Kategorien:
Education, Gender
Es wurde aktualisiert:
23 Apr 2017 Jahr
Kennzahlen der Wertänderungen vom Jahr zum Jahr
Minimum:
72.687
1 Jan 1989 Jahr
Maximum:
91.398
1 Jan 2011 Jahr
Zum Datum der Beobachtung
Wert
Absolute Veränderung
Die Veränderung bezüglich dem vorherigen Wert
1 Jan 1989 Jahr
72.687
+72.687
0.0%
1 Jan 1990 Jahr
73.703
+1.016
1.4%
1 Jan 1991 Jahr
73.932
+0.229
0.31%
1 Jan 1992 Jahr
75.359
+1.427
1.93%
1 Jan 1993 Jahr
77.362
+2.004
2.66%
1 Jan 1994 Jahr
78.355
+0.992
1.28%
1 Jan 1995 Jahr
78.673
+0.318
0.41%
1 Jan 1996 Jahr
81.304
+2.632
3.35%
1 Jan 1997 Jahr
83.527
+2.223
2.73%
1 Jan 1998 Jahr
83.304
-0.223
-0.27%
1 Jan 1999 Jahr
84.614
+1.31
1.57%
1 Jan 2000 Jahr
85.597
+0.983
1.16%
1 Jan 2001 Jahr
86.248
+0.65
0.76%
1 Jan 2002 Jahr
87.681
+1.434
1.66%
1 Jan 2003 Jahr
88.862
+1.18
1.35%
1 Jan 2004 Jahr
88.038
-0.823
-0.93%
1 Jan 2005 Jahr
88.155
+0.117
0.13%
1 Jan 2006 Jahr
89.434
+1.279
1.45%
1 Jan 2007 Jahr
90.597
+1.163
1.3%
1 Jan 2008 Jahr
90.968
+0.37
0.41%
1 Jan 2009 Jahr
90.818
-0.149
-0.16%
1 Jan 2010 Jahr
91.276
+0.458
0.5%
1 Jan 2011 Jahr
91.398
+0.121
0.13%
1 Jan 2012 Jahr
91.346
-0.052
-0.06%
1 Jan 2013 Jahr
90.438
-0.908
-0.99%
1 Jan 2014 Jahr
90.18
-0.258
-0.29%
Bewertung der Länder gemäß mit laufender Statistik nach Jahren


Kommentare: