29
/de/
de
AIzaSyAYiBZKx7MnpbEhh9jyipgxe19OcubqV5w
April 1, 2024
62610
World
WLD
false
2
1
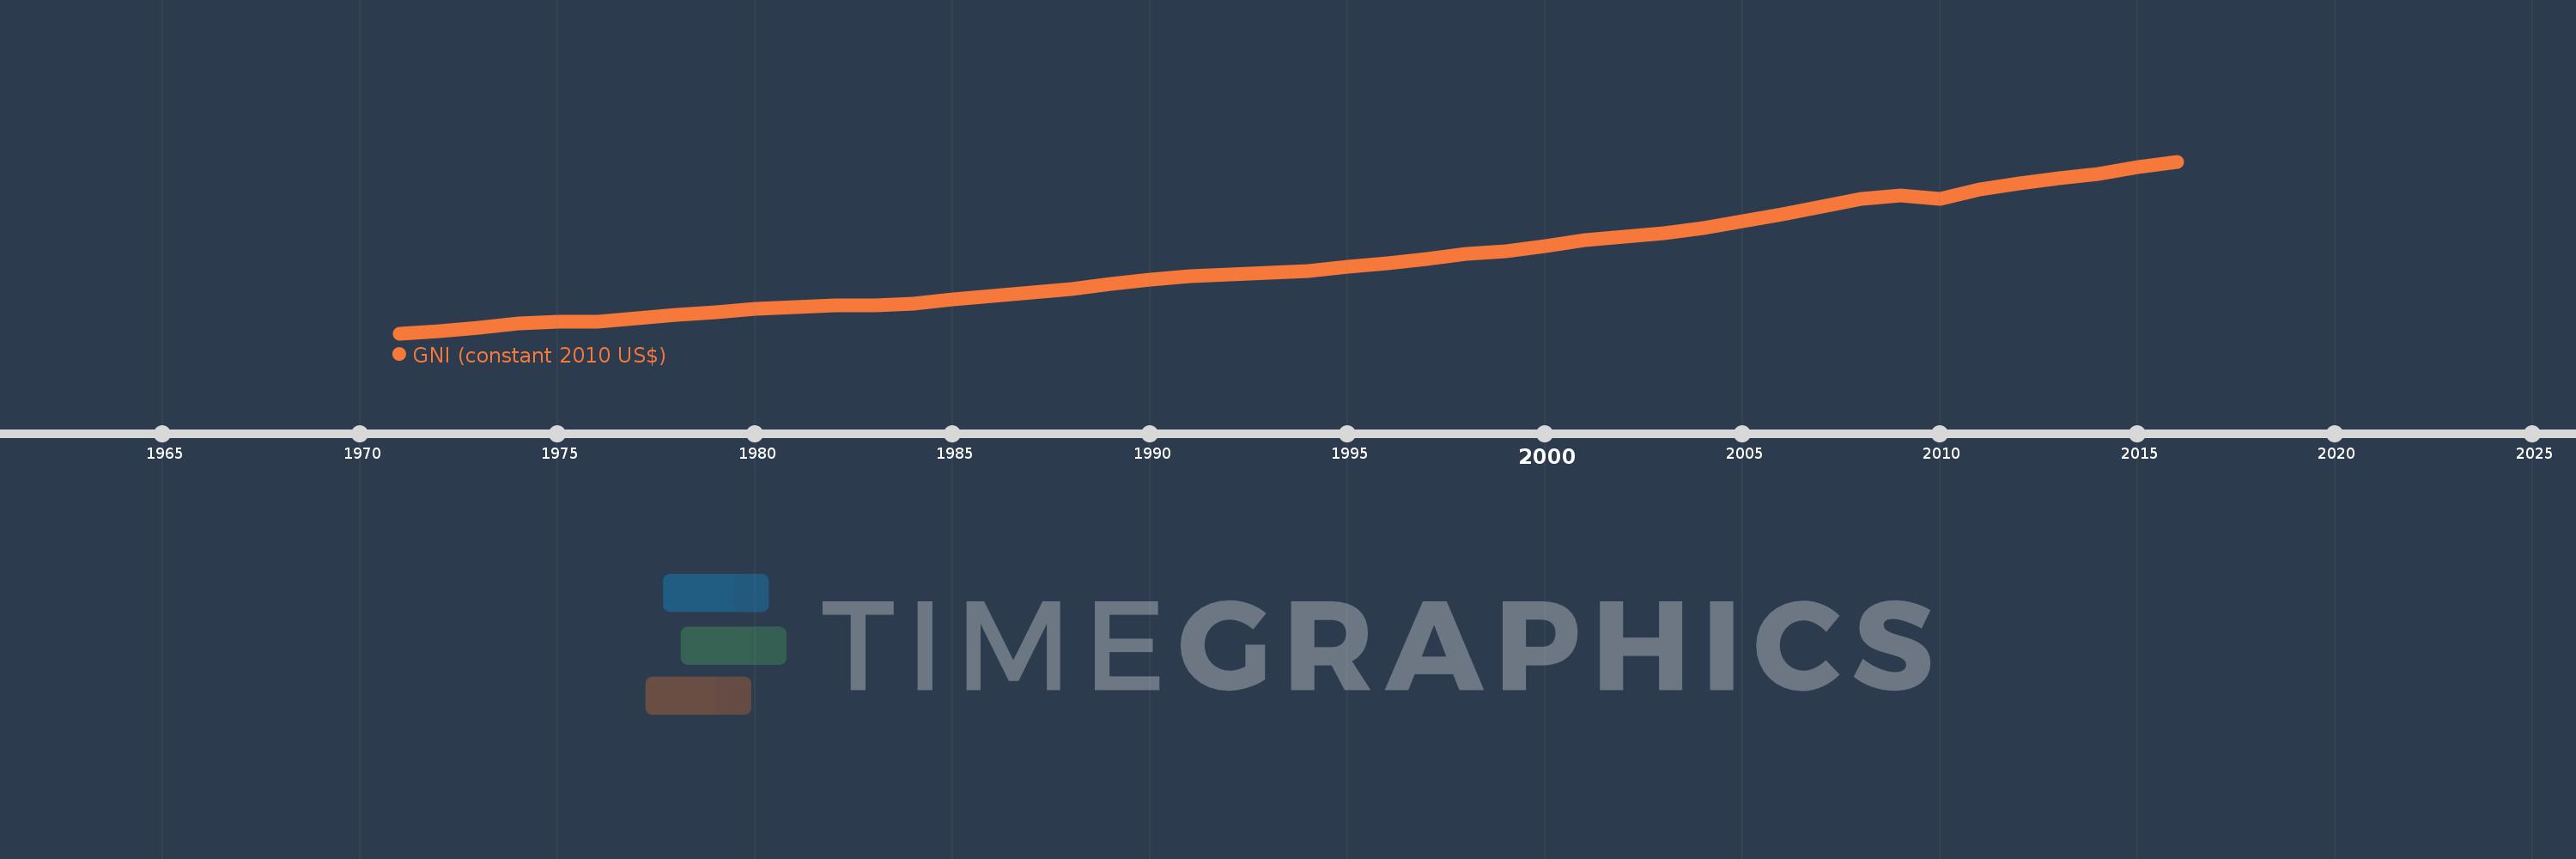
GNI (constant 2010 US$)
2016,2015,2014,2013,2012,2011,2010,2009,2008,2007,2006,2005,2004,2003,2002,2001,2000,1999,1998,1997,1996,1995,1994,1993,1992,1991,1990,1989,1988,1987,1986,1985,1984,1983,1982,1981,1980,1979,1978,1977,1976,1975,1974,1973,1972,1971
Diese Statistik in anderen Ländern:
AfghanistanAlbaniaAlgeriaAndorraAngolaAntigua and BarbudaArab WorldArgentinaArmeniaAustraliaAustriaAzerbaijanBahamas, TheBahrainBangladeshBarbadosBelarusBelgiumBelizeBeninBermudaBhutanBoliviaBosnia and HerzegovinaBotswanaBrazilBrunei DarussalamBulgariaBurkina FasoBurundiCabo VerdeCambodiaCameroonCanadaCaribbean small statesCentral African RepublicCentral Europe and the BalticsChadChileChinaColombiaComorosCongo, Dem. Rep.Congo, Rep.Costa RicaCote d'IvoireCroatiaCubaCyprusCzech RepublicDenmarkDominicaDominican RepublicEarly-demographic dividendEast Asia & PacificEast Asia & Pacific (excluding high income)East Asia & Pacific (IDA & IBRD countries)EcuadorEgypt, Arab Rep.El SalvadorEquatorial GuineaEritreaEstoniaEthiopiaEuro areaEurope & Central AsiaEurope & Central Asia (excluding high income)Europe & Central Asia (IDA & IBRD countries)European UnionFaroe IslandsFijiFinlandFragile and conflict affected situationsFranceGabonGambia, TheGeorgiaGermanyGhanaGreeceGrenadaGuatemalaGuineaGuinea-BissauGuyanaHaitiHeavily indebted poor countries (HIPC)High incomeHondurasHong Kong SAR, ChinaHungaryIBRD onlyIcelandIDA & IBRD totalIDA blendIDA onlyIDA totalIndiaIndonesiaIran, Islamic Rep.IraqIrelandIsle of ManIsraelItalyJamaicaJapanJordanKazakhstanKenyaKiribatiKorea, Rep.KosovoKuwaitKyrgyz RepublicLao PDRLate-demographic dividendLatin America & Caribbean Latin America & Caribbean (excluding high income)Latin America & the Caribbean (IDA & IBRD countries)LatviaLeast developed countries: UN classificationLebanonLesothoLiberiaLibyaLiechtensteinLithuaniaLow & middle incomeLow incomeLower middle incomeLuxembourgMacao SAR, ChinaMacedonia, FYRMadagascarMalawiMalaysiaMaldivesMaliMaltaMarshall IslandsMauritaniaMauritiusMexicoMicronesia, Fed. Sts.Middle East & North AfricaMiddle East & North Africa (excluding high income)Middle East & North Africa (IDA & IBRD countries)Middle incomeMoldovaMongoliaMontenegroMoroccoMozambiqueMyanmarNamibiaNauruNepalNetherlandsNew ZealandNicaraguaNigerNigeriaNorth AmericaNorwayOECD membersOmanOther small statesPacific island small statesPakistanPalauPanamaPapua New GuineaParaguayPeruPhilippinesPolandPortugalPost-demographic dividendPre-demographic dividendPuerto RicoQatarRomaniaRussian FederationRwandaSamoaSao Tome and PrincipeSaudi ArabiaSenegalSerbiaSeychellesSierra LeoneSingaporeSlovak RepublicSloveniaSmall statesSolomon IslandsSouth AfricaSouth AsiaSouth Asia (IDA & IBRD)South SudanSpainSri LankaSt. Kitts and NevisSt. LuciaSt. Vincent and the GrenadinesSub-Saharan Africa Sub-Saharan Africa (excluding high income)Sub-Saharan Africa (IDA & IBRD countries)SudanSurinameSwazilandSwedenSwitzerlandTajikistanTanzaniaThailandTimor-LesteTogoTongaTrinidad and TobagoTunisiaTurkeyTurkmenistanTuvaluUgandaUkraineUnited Arab EmiratesUnited KingdomUnited StatesUpper middle incomeUruguayUzbekistanVanuatuVenezuela, RBVietnamWest Bank and GazaWorldYemen, Rep.ZambiaZimbabwe Zeitlinie:
Diese Zeitleiste vorliegt die Graphik ab 1971 J. bis 2016 J. World. Die Angaben bis 1970 J. sind nicht vorhanden. Die Zahl aktueller Beobachtungen nach Daten: 46.
Die Quelle (Bezeichnung):
Kennzahlen der Weltentwicklung
Die Quelle (Einrichtung):
World Bank national accounts data, and OECD National Accounts data files.
Kategorien:
Economy & Growth
Es wurde aktualisiert:
23 Apr 2017 Jahr
Kennzahlen der Wertänderungen vom Jahr zum Jahr
im Durchschnitt:
42.447 Trln
Minimum:
19.307 Trln
1 Jan 1971 Jahr
Maximum:
74.817 Trln
1 Jan 2016 Jahr
Zum Datum der Beobachtung
Wert
Absolute Veränderung
Die Veränderung bezüglich dem vorherigen Wert
1 Jan 1971 Jahr
19.307 Trln
+19.307 Trln
0.0%
1 Jan 1972 Jahr
20.072 Trln
+764.857 Mlrd.
3.96%
1 Jan 1973 Jahr
21.185 Trln
+1.113 Trln
5.55%
1 Jan 1974 Jahr
22.557 Trln
+1.371 Trln
6.47%
1 Jan 1975 Jahr
22.922 Trln
+365.082 Mlrd.
1.62%
1 Jan 1976 Jahr
23.06 Trln
+138.008 Mlrd.
0.6%
1 Jan 1977 Jahr
24.208 Trln
+1.148 Trln
4.98%
1 Jan 1978 Jahr
25.151 Trln
+942.665 Mlrd.
3.89%
1 Jan 1979 Jahr
26.243 Trln
+1.092 Trln
4.34%
1 Jan 1980 Jahr
27.311 Trln
+1.068 Trln
4.07%
1 Jan 1981 Jahr
27.755 Trln
+444.354 Mlrd.
1.63%
1 Jan 1982 Jahr
28.216 Trln
+461.017 Mlrd.
1.66%
1 Jan 1983 Jahr
28.289 Trln
+73.311 Mlrd.
0.26%
1 Jan 1984 Jahr
29.019 Trln
+730.118 Mlrd.
2.58%
1 Jan 1985 Jahr
30.302 Trln
+1.283 Trln
4.42%
1 Jan 1986 Jahr
31.452 Trln
+1.15 Trln
3.79%
1 Jan 1987 Jahr
32.453 Trln
+1.002 Trln
3.19%
1 Jan 1988 Jahr
33.638 Trln
+1.185 Trln
3.65%
1 Jan 1989 Jahr
35.183 Trln
+1.544 Trln
4.59%
1 Jan 1990 Jahr
36.649 Trln
+1.466 Trln
4.17%
1 Jan 1991 Jahr
37.656 Trln
+1.007 Trln
2.75%
1 Jan 1992 Jahr
38.2 Trln
+544.051 Mlrd.
1.44%
1 Jan 1993 Jahr
38.871 Trln
+671.358 Mlrd.
1.76%
1 Jan 1994 Jahr
39.555 Trln
+683.571 Mlrd.
1.76%
1 Jan 1995 Jahr
40.681 Trln
+1.126 Trln
2.85%
1 Jan 1996 Jahr
41.868 Trln
+1.187 Trln
2.92%
1 Jan 1997 Jahr
43.291 Trln
+1.423 Trln
3.4%
1 Jan 1998 Jahr
44.91 Trln
+1.62 Trln
3.74%
1 Jan 1999 Jahr
45.892 Trln
+981.419 Mlrd.
2.19%
1 Jan 2000 Jahr
47.438 Trln
+1.546 Trln
3.37%
1 Jan 2001 Jahr
49.538 Trln
+2.1 Trln
4.43%
1 Jan 2002 Jahr
50.518 Trln
+980.3 Mlrd.
1.98%
1 Jan 2003 Jahr
51.58 Trln
+1.062 Trln
2.1%
1 Jan 2004 Jahr
53.195 Trln
+1.616 Trln
3.13%
1 Jan 2005 Jahr
55.589 Trln
+2.394 Trln
4.5%
1 Jan 2006 Jahr
57.693 Trln
+2.105 Trln
3.79%
1 Jan 2007 Jahr
60.243 Trln
+2.549 Trln
4.42%
1 Jan 2008 Jahr
62.88 Trln
+2.637 Trln
4.38%
1 Jan 2009 Jahr
63.892 Trln
+1.012 Trln
1.61%
1 Jan 2010 Jahr
62.798 Trln
-1.094 Trln
-1.71%
1 Jan 2011 Jahr
65.685 Trln
+2.887 Trln
4.6%
1 Jan 2012 Jahr
67.655 Trln
+1.97 Trln
3.0%
1 Jan 2013 Jahr
69.28 Trln
+1.625 Trln
2.4%
1 Jan 2014 Jahr
70.898 Trln
+1.618 Trln
2.34%
1 Jan 2015 Jahr
72.963 Trln
+2.065 Trln
2.91%
1 Jan 2016 Jahr
74.817 Trln
+1.853 Trln
2.54%
Bewertung der Länder gemäß mit laufender Statistik nach Jahren


Kommentare: