29
/de/
de
AIzaSyAYiBZKx7MnpbEhh9jyipgxe19OcubqV5w
April 1, 2024
42395
Latin America & Caribbean (excluding high income)
LAC
false
2
1
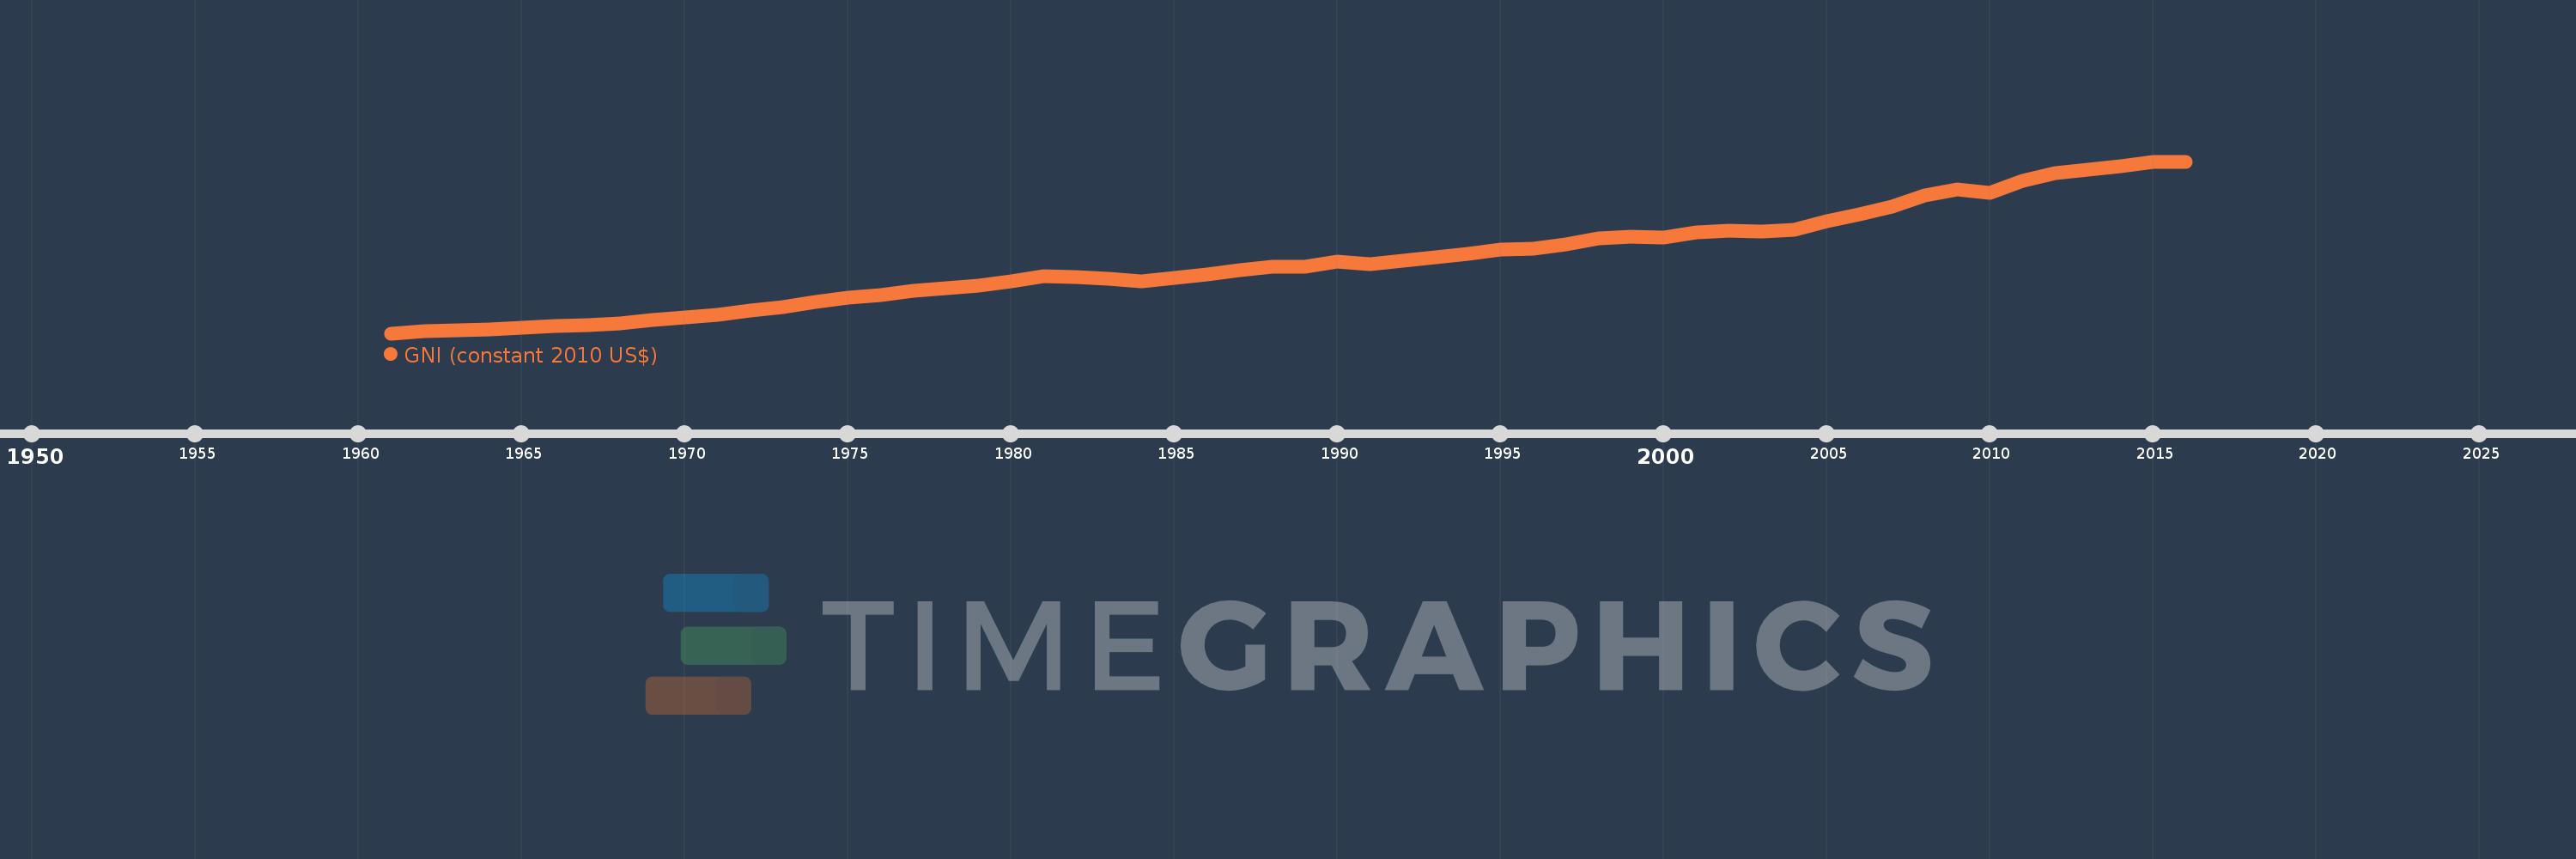
GNI (constant 2010 US$)
2016,2015,2014,2013,2012,2011,2010,2009,2008,2007,2006,2005,2004,2003,2002,2001,2000,1999,1998,1997,1996,1995,1994,1993,1992,1991,1990,1989,1988,1987,1986,1985,1984,1983,1982,1981,1980,1979,1978,1977,1976,1975,1974,1973,1972,1971,1970,1969,1968,1967,1966,1965,1964,1963,1962,1961
Diese Statistik in anderen Ländern:
AfghanistanAlbaniaAlgeriaAndorraAngolaAntigua and BarbudaArab WorldArgentinaArmeniaAustraliaAustriaAzerbaijanBahamas, TheBahrainBangladeshBarbadosBelarusBelgiumBelizeBeninBermudaBhutanBoliviaBosnia and HerzegovinaBotswanaBrazilBrunei DarussalamBulgariaBurkina FasoBurundiCabo VerdeCambodiaCameroonCanadaCaribbean small statesCentral African RepublicCentral Europe and the BalticsChadChileChinaColombiaComorosCongo, Dem. Rep.Congo, Rep.Costa RicaCote d'IvoireCroatiaCubaCyprusCzech RepublicDenmarkDominicaDominican RepublicEarly-demographic dividendEast Asia & PacificEast Asia & Pacific (excluding high income)East Asia & Pacific (IDA & IBRD countries)EcuadorEgypt, Arab Rep.El SalvadorEquatorial GuineaEritreaEstoniaEthiopiaEuro areaEurope & Central AsiaEurope & Central Asia (excluding high income)Europe & Central Asia (IDA & IBRD countries)European UnionFaroe IslandsFijiFinlandFragile and conflict affected situationsFranceGabonGambia, TheGeorgiaGermanyGhanaGreeceGrenadaGuatemalaGuineaGuinea-BissauGuyanaHaitiHeavily indebted poor countries (HIPC)High incomeHondurasHong Kong SAR, ChinaHungaryIBRD onlyIcelandIDA & IBRD totalIDA blendIDA onlyIDA totalIndiaIndonesiaIran, Islamic Rep.IraqIrelandIsle of ManIsraelItalyJamaicaJapanJordanKazakhstanKenyaKiribatiKorea, Rep.KosovoKuwaitKyrgyz RepublicLao PDRLate-demographic dividendLatin America & Caribbean Latin America & Caribbean (excluding high income)Latin America & the Caribbean (IDA & IBRD countries)LatviaLeast developed countries: UN classificationLebanonLesothoLiberiaLibyaLiechtensteinLithuaniaLow & middle incomeLow incomeLower middle incomeLuxembourgMacao SAR, ChinaMacedonia, FYRMadagascarMalawiMalaysiaMaldivesMaliMaltaMarshall IslandsMauritaniaMauritiusMexicoMicronesia, Fed. Sts.Middle East & North AfricaMiddle East & North Africa (excluding high income)Middle East & North Africa (IDA & IBRD countries)Middle incomeMoldovaMongoliaMontenegroMoroccoMozambiqueMyanmarNamibiaNauruNepalNetherlandsNew ZealandNicaraguaNigerNigeriaNorth AmericaNorwayOECD membersOmanOther small statesPacific island small statesPakistanPalauPanamaPapua New GuineaParaguayPeruPhilippinesPolandPortugalPost-demographic dividendPre-demographic dividendPuerto RicoQatarRomaniaRussian FederationRwandaSamoaSao Tome and PrincipeSaudi ArabiaSenegalSerbiaSeychellesSierra LeoneSingaporeSlovak RepublicSloveniaSmall statesSolomon IslandsSouth AfricaSouth AsiaSouth Asia (IDA & IBRD)South SudanSpainSri LankaSt. Kitts and NevisSt. LuciaSt. Vincent and the GrenadinesSub-Saharan Africa Sub-Saharan Africa (excluding high income)Sub-Saharan Africa (IDA & IBRD countries)SudanSurinameSwazilandSwedenSwitzerlandTajikistanTanzaniaThailandTimor-LesteTogoTongaTrinidad and TobagoTunisiaTurkeyTurkmenistanTuvaluUgandaUkraineUnited Arab EmiratesUnited KingdomUnited StatesUpper middle incomeUruguayUzbekistanVanuatuVenezuela, RBVietnamWest Bank and GazaWorldYemen, Rep.ZambiaZimbabwe Zeitlinie:
Diese Zeitleiste vorliegt die Graphik ab 1961 J. bis 2016 J. Latin America & Caribbean (excluding high income). Die Angaben bis 1960 J. sind nicht vorhanden. Die Zahl aktueller Beobachtungen nach Daten: 56.
Die Quelle (Bezeichnung):
Kennzahlen der Weltentwicklung
Die Quelle (Einrichtung):
World Bank national accounts data, and OECD National Accounts data files.
Kategorien:
Economy & Growth
Es wurde aktualisiert:
23 Apr 2017 Jahr
Kennzahlen der Wertänderungen vom Jahr zum Jahr
im Durchschnitt:
2.667 Trln
Minimum:
704.34 Mlrd.
1 Jan 1961 Jahr
Maximum:
5.366 Trln
1 Jan 2015 Jahr
Zum Datum der Beobachtung
Wert
Absolute Veränderung
Die Veränderung bezüglich dem vorherigen Wert
1 Jan 1961 Jahr
704.34 Mlrd.
+704.34 Mlrd.
0.0%
1 Jan 1962 Jahr
755.741 Mlrd.
+51.402 Mlrd.
7.3%
1 Jan 1963 Jahr
788.011 Mlrd.
+32.269 Mlrd.
4.27%
1 Jan 1964 Jahr
803.333 Mlrd.
+15.322 Mlrd.
1.94%
1 Jan 1965 Jahr
859.854 Mlrd.
+56.521 Mlrd.
7.04%
1 Jan 1966 Jahr
907.887 Mlrd.
+48.033 Mlrd.
5.59%
1 Jan 1967 Jahr
928.526 Mlrd.
+20.639 Mlrd.
2.27%
1 Jan 1968 Jahr
975.321 Mlrd.
+46.795 Mlrd.
5.04%
1 Jan 1969 Jahr
1.059 Trln
+83.938 Mlrd.
8.61%
1 Jan 1970 Jahr
1.14 Trln
+81.077 Mlrd.
7.65%
1 Jan 1971 Jahr
1.212 Trln
+72.092 Mlrd.
6.32%
1 Jan 1972 Jahr
1.317 Trln
+104.376 Mlrd.
8.61%
1 Jan 1973 Jahr
1.424 Trln
+107.376 Mlrd.
8.15%
1 Jan 1974 Jahr
1.565 Trln
+140.379 Mlrd.
9.86%
1 Jan 1975 Jahr
1.676 Trln
+111.632 Mlrd.
7.14%
1 Jan 1976 Jahr
1.748 Trln
+72.15 Mlrd.
4.3%
1 Jan 1977 Jahr
1.853 Trln
+104.653 Mlrd.
5.99%
1 Jan 1978 Jahr
1.933 Trln
+80.216 Mlrd.
4.33%
1 Jan 1979 Jahr
1.999 Trln
+65.979 Mlrd.
3.41%
1 Jan 1980 Jahr
2.124 Trln
+124.471 Mlrd.
6.23%
1 Jan 1981 Jahr
2.254 Trln
+129.934 Mlrd.
6.12%
1 Jan 1982 Jahr
2.238 Trln
-15.21 Mlrd.
-0.67%
1 Jan 1983 Jahr
2.183 Trln
-55.829 Mlrd.
-2.49%
1 Jan 1984 Jahr
2.123 Trln
-59.965 Mlrd.
-2.75%
1 Jan 1985 Jahr
2.207 Trln
+84.562 Mlrd.
3.98%
1 Jan 1986 Jahr
2.295 Trln
+87.382 Mlrd.
3.96%
1 Jan 1987 Jahr
2.411 Trln
+116.584 Mlrd.
5.08%
1 Jan 1988 Jahr
2.501 Trln
+90.289 Mlrd.
3.74%
1 Jan 1989 Jahr
2.521 Trln
+19.28 Mlrd.
0.77%
1 Jan 1990 Jahr
2.65 Trln
+129.599 Mlrd.
5.14%
1 Jan 1991 Jahr
2.577 Trln
-73.316 Mlrd.
-2.77%
1 Jan 1992 Jahr
2.684 Trln
+106.713 Mlrd.
4.14%
1 Jan 1993 Jahr
2.757 Trln
+73.631 Mlrd.
2.74%
1 Jan 1994 Jahr
2.862 Trln
+104.759 Mlrd.
3.8%
1 Jan 1995 Jahr
2.975 Trln
+113.173 Mlrd.
3.95%
1 Jan 1996 Jahr
3.008 Trln
+33.125 Mlrd.
1.11%
1 Jan 1997 Jahr
3.12 Trln
+111.658 Mlrd.
3.71%
1 Jan 1998 Jahr
3.274 Trln
+154.02 Mlrd.
4.94%
1 Jan 1999 Jahr
3.321 Trln
+46.506 Mlrd.
1.42%
1 Jan 2000 Jahr
3.31 Trln
-10.069 Mlrd.
-0.3%
1 Jan 2001 Jahr
3.452 Trln
+141.444 Mlrd.
4.27%
1 Jan 2002 Jahr
3.478 Trln
+26.268 Mlrd.
0.76%
1 Jan 2003 Jahr
3.475 Trln
-3.249 Mlrd.
-0.09%
1 Jan 2004 Jahr
3.523 Trln
+47.679 Mlrd.
1.37%
1 Jan 2005 Jahr
3.754 Trln
+231.083 Mlrd.
6.56%
1 Jan 2006 Jahr
3.93 Trln
+176.311 Mlrd.
4.7%
1 Jan 2007 Jahr
4.147 Trln
+217.214 Mlrd.
5.53%
1 Jan 2008 Jahr
4.434 Trln
+286.564 Mlrd.
6.91%
1 Jan 2009 Jahr
4.603 Trln
+168.714 Mlrd.
3.81%
1 Jan 2010 Jahr
4.514 Trln
-88.286 Mlrd.
-1.92%
1 Jan 2011 Jahr
4.844 Trln
+330.134 Mlrd.
7.31%
1 Jan 2012 Jahr
5.047 Trln
+202.293 Mlrd.
4.18%
1 Jan 2013 Jahr
5.149 Trln
+101.907 Mlrd.
2.02%
1 Jan 2014 Jahr
5.249 Trln
+99.946 Mlrd.
1.94%
1 Jan 2015 Jahr
5.366 Trln
+117.456 Mlrd.
2.24%
1 Jan 2016 Jahr
5.345 Trln
-21.062 Mlrd.
-0.39%
Bewertung der Länder gemäß mit laufender Statistik nach Jahren


Kommentare: