29
/de/
de
AIzaSyAYiBZKx7MnpbEhh9jyipgxe19OcubqV5w
April 1, 2024
61714
Upper middle income
UMC
false
2
1
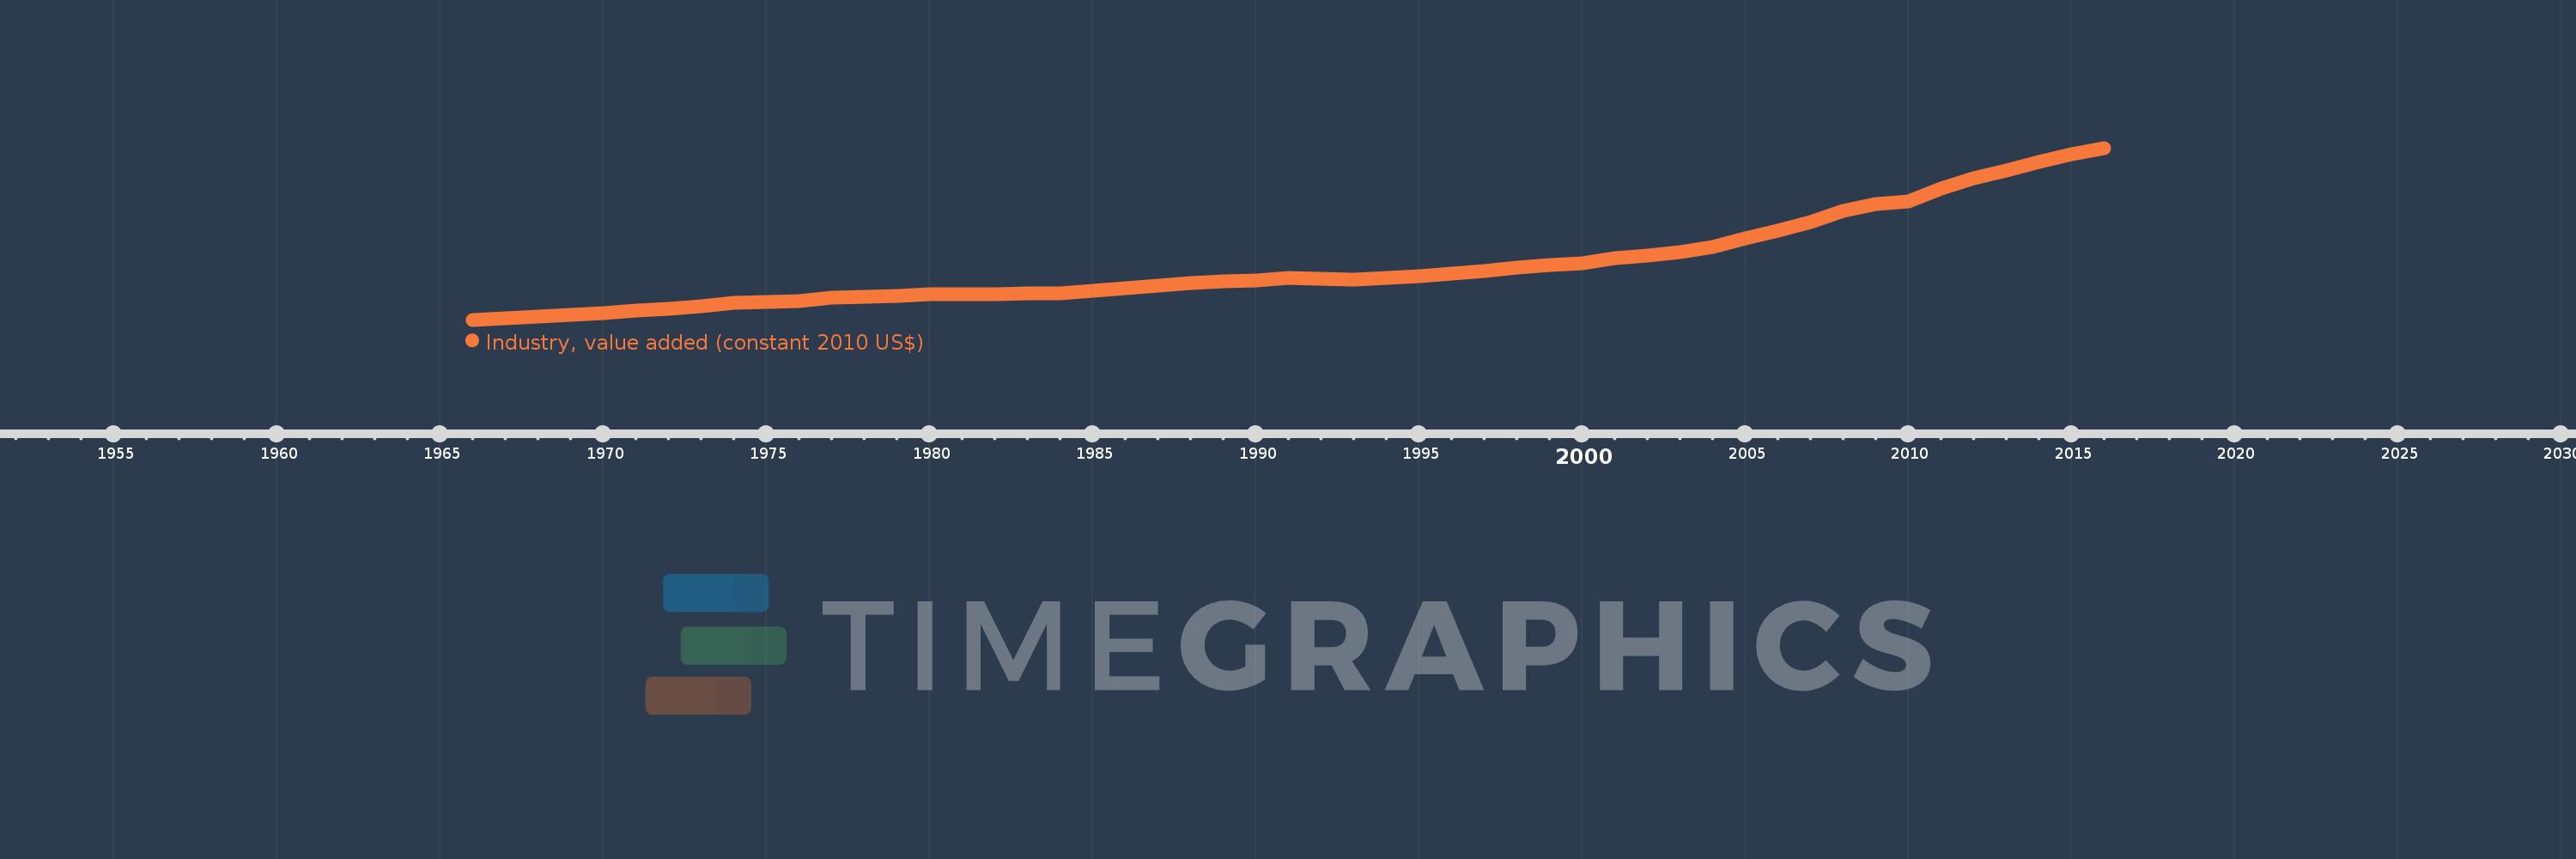
Industry, value added (constant 2010 US$)
2016,2015,2014,2013,2012,2011,2010,2009,2008,2007,2006,2005,2004,2003,2002,2001,2000,1999,1998,1997,1996,1995,1994,1993,1992,1991,1990,1989,1988,1987,1986,1985,1984,1983,1982,1981,1980,1979,1978,1977,1976,1975,1974,1973,1972,1971,1970,1969,1968,1967,1966
Diese Statistik in anderen Ländern:
AfghanistanAlbaniaAlgeriaAndorraAntigua and BarbudaArab WorldArgentinaArmeniaArubaAustraliaAustriaAzerbaijanBahamas, TheBahrainBangladeshBarbadosBelarusBelgiumBelizeBeninBermudaBhutanBoliviaBosnia and HerzegovinaBotswanaBrazilBrunei DarussalamBulgariaBurkina FasoBurundiCabo VerdeCambodiaCameroonCanadaCaribbean small statesCentral African RepublicCentral Europe and the BalticsChadChileChinaColombiaComorosCongo, Dem. Rep.Congo, Rep.Costa RicaCote d'IvoireCroatiaCubaCyprusCzech RepublicDenmarkDominicaDominican RepublicEarly-demographic dividendEast Asia & PacificEast Asia & Pacific (excluding high income)East Asia & Pacific (IDA & IBRD countries)EcuadorEgypt, Arab Rep.El SalvadorEquatorial GuineaEstoniaEthiopiaEuro areaEurope & Central AsiaEurope & Central Asia (excluding high income)Europe & Central Asia (IDA & IBRD countries)European UnionFijiFinlandFragile and conflict affected situationsFranceGabonGambia, TheGeorgiaGermanyGhanaGreeceGrenadaGuatemalaGuineaGuinea-BissauGuyanaHeavily indebted poor countries (HIPC)High incomeHondurasHong Kong SAR, ChinaHungaryIBRD onlyIcelandIDA & IBRD totalIDA blendIDA onlyIDA totalIndiaIndonesiaIran, Islamic Rep.IraqIrelandItalyJamaicaJapanJordanKazakhstanKenyaKiribatiKorea, Rep.KosovoKuwaitKyrgyz RepublicLao PDRLate-demographic dividendLatin America & Caribbean Latin America & Caribbean (excluding high income)Latin America & the Caribbean (IDA & IBRD countries)LatviaLeast developed countries: UN classificationLebanonLesothoLiberiaLiechtensteinLithuaniaLow & middle incomeLow incomeLower middle incomeLuxembourgMacao SAR, ChinaMacedonia, FYRMadagascarMalawiMalaysiaMaldivesMaliMaltaMarshall IslandsMauritaniaMauritiusMexicoMicronesia, Fed. Sts.Middle East & North AfricaMiddle East & North Africa (excluding high income)Middle East & North Africa (IDA & IBRD countries)Middle incomeMoldovaMongoliaMontenegroMoroccoMozambiqueMyanmarNamibiaNepalNetherlandsNew ZealandNicaraguaNigerNigeriaNorth AmericaNorwayOECD membersOmanOther small statesPacific island small statesPakistanPalauPanamaParaguayPeruPhilippinesPolandPortugalPost-demographic dividendPre-demographic dividendPuerto RicoQatarRomaniaRussian FederationRwandaSamoaSao Tome and PrincipeSaudi ArabiaSenegalSerbiaSeychellesSierra LeoneSingaporeSlovak RepublicSloveniaSmall statesSouth AfricaSouth AsiaSouth Asia (IDA & IBRD)SpainSri LankaSt. Kitts and NevisSt. LuciaSt. Vincent and the GrenadinesSub-Saharan Africa Sub-Saharan Africa (excluding high income)Sub-Saharan Africa (IDA & IBRD countries)SudanSurinameSwazilandSwedenSwitzerlandTajikistanTanzaniaThailandTimor-LesteTogoTongaTrinidad and TobagoTunisiaTurkeyTurkmenistanTuvaluUgandaUkraineUnited Arab EmiratesUnited KingdomUnited StatesUpper middle incomeUruguayUzbekistanVanuatuVenezuela, RBVietnamWest Bank and GazaWorldYemen, Rep.ZambiaZimbabwe Zeitlinie:
Diese Zeitleiste vorliegt die Graphik ab 1966 J. bis 2016 J. Upper middle income. Die Angaben bis 1965 J. sind nicht vorhanden. Die Zahl aktueller Beobachtungen nach Daten: 51.
Die Quelle (Bezeichnung):
Kennzahlen der Weltentwicklung
Die Quelle (Einrichtung):
World Bank national accounts data, and OECD National Accounts data files.
Kategorien:
Economy & Growth
Es wurde aktualisiert:
23 Apr 2017 Jahr
Kennzahlen der Wertänderungen vom Jahr zum Jahr
im Durchschnitt:
2.879 Trln
Minimum:
761.364 Mlrd.
1 Jan 1966 Jahr
Maximum:
7.46 Trln
1 Jan 2016 Jahr
Zum Datum der Beobachtung
Wert
Absolute Veränderung
Die Veränderung bezüglich dem vorherigen Wert
1 Jan 1966 Jahr
761.364 Mlrd.
+761.364 Mlrd.
0.0%
1 Jan 1967 Jahr
830.181 Mlrd.
+68.816 Mlrd.
9.04%
1 Jan 1968 Jahr
870.625 Mlrd.
+40.445 Mlrd.
4.87%
1 Jan 1969 Jahr
946.984 Mlrd.
+76.359 Mlrd.
8.77%
1 Jan 1970 Jahr
1.031 Trln
+84.067 Mlrd.
8.88%
1 Jan 1971 Jahr
1.13 Trln
+99.128 Mlrd.
9.61%
1 Jan 1972 Jahr
1.195 Trln
+65.005 Mlrd.
5.75%
1 Jan 1973 Jahr
1.301 Trln
+105.763 Mlrd.
8.85%
1 Jan 1974 Jahr
1.433 Trln
+132.066 Mlrd.
10.15%
1 Jan 1975 Jahr
1.47 Trln
+37.125 Mlrd.
2.59%
1 Jan 1976 Jahr
1.48 Trln
+9.402 Mlrd.
0.64%
1 Jan 1977 Jahr
1.608 Trln
+128.874 Mlrd.
8.71%
1 Jan 1978 Jahr
1.643 Trln
+34.305 Mlrd.
2.13%
1 Jan 1979 Jahr
1.7 Trln
+57.156 Mlrd.
3.48%
1 Jan 1980 Jahr
1.76 Trln
+60.293 Mlrd.
3.55%
1 Jan 1981 Jahr
1.773 Trln
+12.5 Mlrd.
0.71%
1 Jan 1982 Jahr
1.753 Trln
-19.994 Mlrd.
-1.13%
1 Jan 1983 Jahr
1.803 Trln
+50.65 Mlrd.
2.89%
1 Jan 1984 Jahr
1.781 Trln
-22.125 Mlrd.
-1.23%
1 Jan 1985 Jahr
1.884 Trln
+102.551 Mlrd.
5.76%
1 Jan 1986 Jahr
1.975 Trln
+91.059 Mlrd.
4.83%
1 Jan 1987 Jahr
2.083 Trln
+108.158 Mlrd.
5.48%
1 Jan 1988 Jahr
2.187 Trln
+103.555 Mlrd.
4.97%
1 Jan 1989 Jahr
2.254 Trln
+67.829 Mlrd.
3.1%
1 Jan 1990 Jahr
2.297 Trln
+42.259 Mlrd.
1.87%
1 Jan 1991 Jahr
2.384 Trln
+87.133 Mlrd.
3.79%
1 Jan 1992 Jahr
2.367 Trln
-16.256 Mlrd.
-0.68%
1 Jan 1993 Jahr
2.331 Trln
-36.755 Mlrd.
-1.55%
1 Jan 1994 Jahr
2.402 Trln
+71.028 Mlrd.
3.05%
1 Jan 1995 Jahr
2.456 Trln
+54.027 Mlrd.
2.25%
1 Jan 1996 Jahr
2.549 Trln
+92.741 Mlrd.
3.78%
1 Jan 1997 Jahr
2.644 Trln
+95.794 Mlrd.
3.76%
1 Jan 1998 Jahr
2.806 Trln
+161.918 Mlrd.
6.12%
1 Jan 1999 Jahr
2.885 Trln
+78.839 Mlrd.
2.81%
1 Jan 2000 Jahr
2.966 Trln
+81.127 Mlrd.
2.81%
1 Jan 2001 Jahr
3.165 Trln
+198.765 Mlrd.
6.7%
1 Jan 2002 Jahr
3.255 Trln
+90.1 Mlrd.
2.85%
1 Jan 2003 Jahr
3.391 Trln
+135.779 Mlrd.
4.17%
1 Jan 2004 Jahr
3.6 Trln
+208.954 Mlrd.
6.16%
1 Jan 2005 Jahr
3.942 Trln
+341.735 Mlrd.
9.49%
1 Jan 2006 Jahr
4.226 Trln
+284.07 Mlrd.
7.21%
1 Jan 2007 Jahr
4.577 Trln
+351.462 Mlrd.
8.32%
1 Jan 2008 Jahr
4.989 Trln
+411.968 Mlrd.
9.0%
1 Jan 2009 Jahr
5.271 Trln
+282.347 Mlrd.
5.66%
1 Jan 2010 Jahr
5.364 Trln
+92.544 Mlrd.
1.76%
1 Jan 2011 Jahr
5.866 Trln
+501.979 Mlrd.
9.36%
1 Jan 2012 Jahr
6.285 Trln
+419.378 Mlrd.
7.15%
1 Jan 2013 Jahr
6.591 Trln
+306.184 Mlrd.
4.87%
1 Jan 2014 Jahr
6.912 Trln
+321.016 Mlrd.
4.87%
1 Jan 2015 Jahr
7.213 Trln
+300.413 Mlrd.
4.35%
1 Jan 2016 Jahr
7.46 Trln
+247.148 Mlrd.
3.43%
Bewertung der Länder gemäß mit laufender Statistik nach Jahren


Kommentare: