29
/de/
de
AIzaSyAYiBZKx7MnpbEhh9jyipgxe19OcubqV5w
April 1, 2024
106122
China
CHN
true
2
1
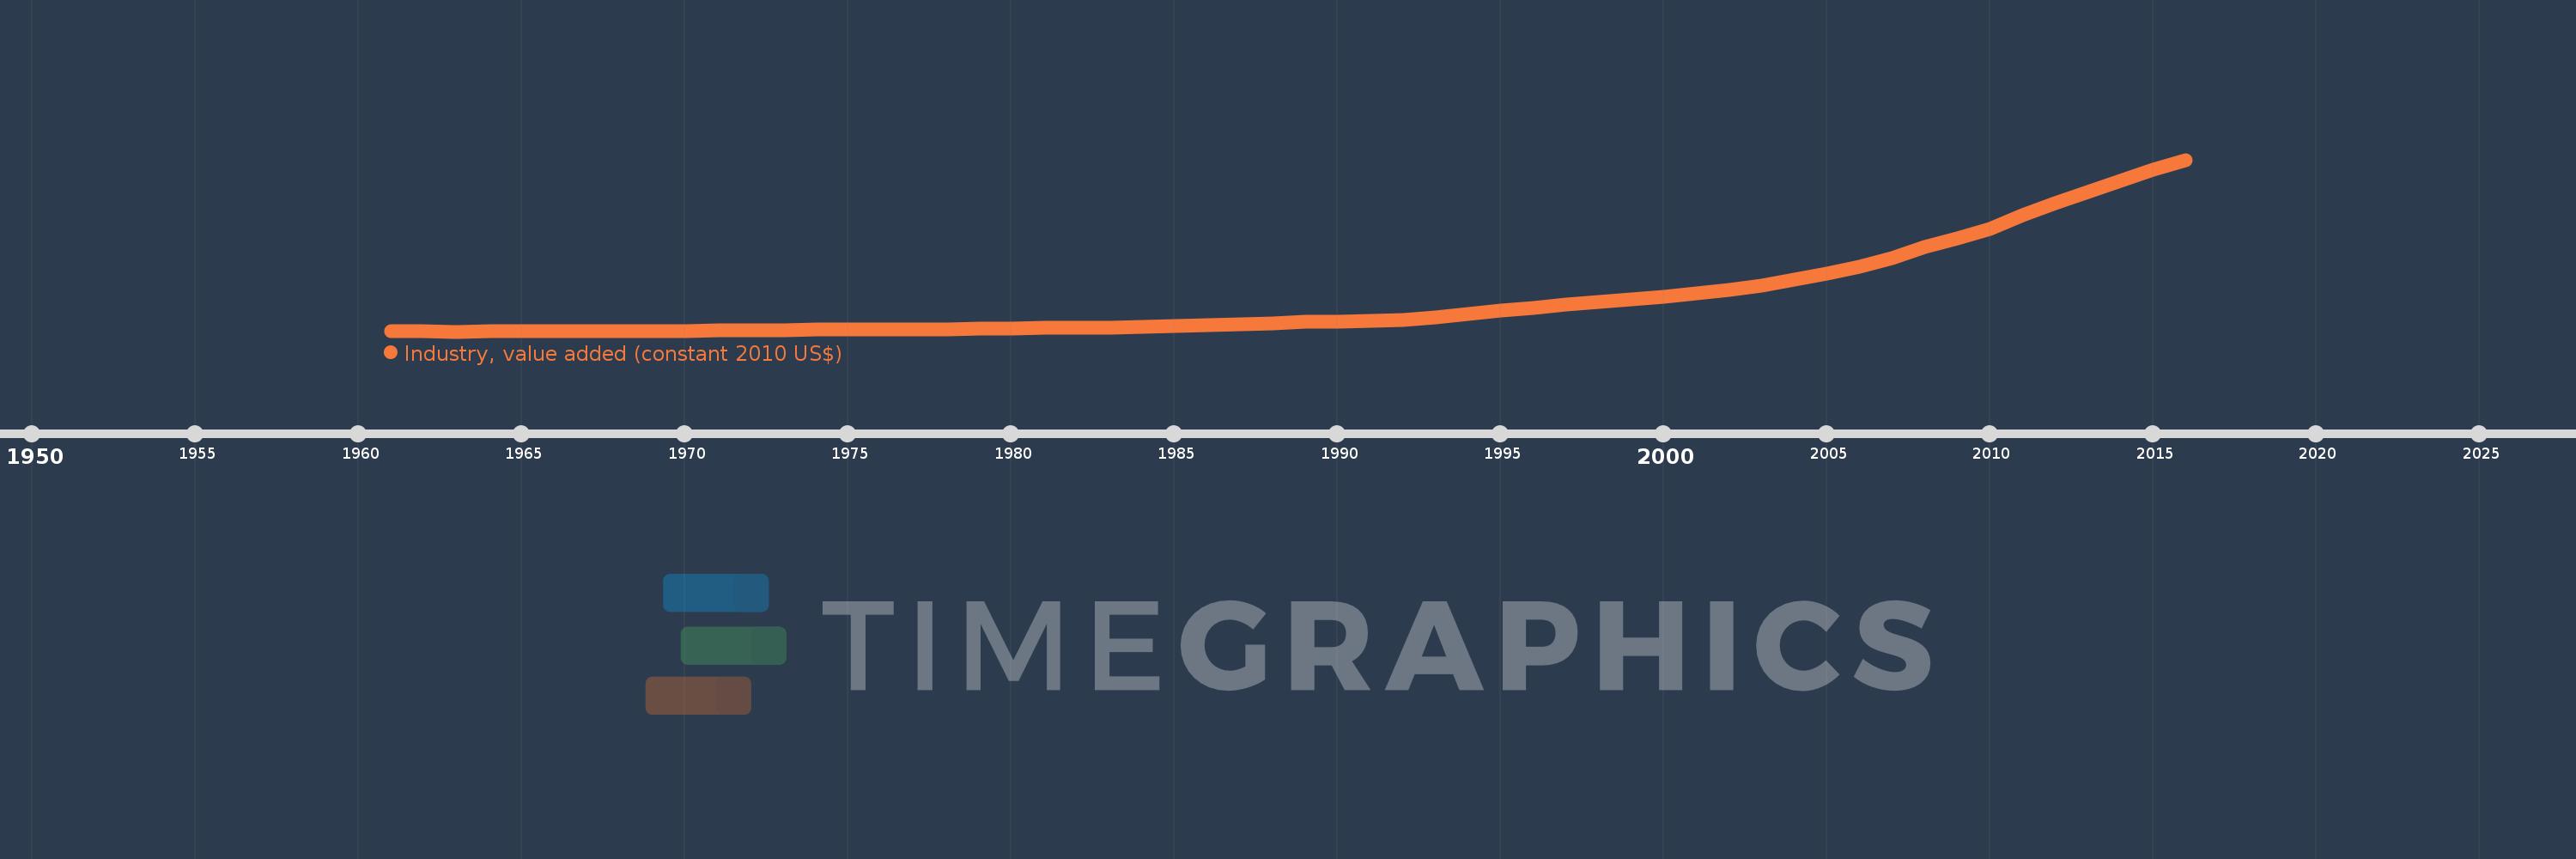
Industry, value added (constant 2010 US$)
2016,2015,2014,2013,2012,2011,2010,2009,2008,2007,2006,2005,2004,2003,2002,2001,2000,1999,1998,1997,1996,1995,1994,1993,1992,1991,1990,1989,1988,1987,1986,1985,1984,1983,1982,1981,1980,1979,1978,1977,1976,1975,1974,1973,1972,1971,1970,1969,1968,1967,1966,1965,1964,1963,1962,1961
Diese Statistik in anderen Ländern:
AfghanistanAlbaniaAlgeriaAndorraAntigua and BarbudaArab WorldArgentinaArmeniaArubaAustraliaAustriaAzerbaijanBahamas, TheBahrainBangladeshBarbadosBelarusBelgiumBelizeBeninBermudaBhutanBoliviaBosnia and HerzegovinaBotswanaBrazilBrunei DarussalamBulgariaBurkina FasoBurundiCabo VerdeCambodiaCameroonCanadaCaribbean small statesCentral African RepublicCentral Europe and the BalticsChadChileChinaColombiaComorosCongo, Dem. Rep.Congo, Rep.Costa RicaCote d'IvoireCroatiaCubaCyprusCzech RepublicDenmarkDominicaDominican RepublicEarly-demographic dividendEast Asia & PacificEast Asia & Pacific (excluding high income)East Asia & Pacific (IDA & IBRD countries)EcuadorEgypt, Arab Rep.El SalvadorEquatorial GuineaEstoniaEthiopiaEuro areaEurope & Central AsiaEurope & Central Asia (excluding high income)Europe & Central Asia (IDA & IBRD countries)European UnionFijiFinlandFragile and conflict affected situationsFranceGabonGambia, TheGeorgiaGermanyGhanaGreeceGrenadaGuatemalaGuineaGuinea-BissauGuyanaHeavily indebted poor countries (HIPC)High incomeHondurasHong Kong SAR, ChinaHungaryIBRD onlyIcelandIDA & IBRD totalIDA blendIDA onlyIDA totalIndiaIndonesiaIran, Islamic Rep.IraqIrelandItalyJamaicaJapanJordanKazakhstanKenyaKiribatiKorea, Rep.KosovoKuwaitKyrgyz RepublicLao PDRLate-demographic dividendLatin America & Caribbean Latin America & Caribbean (excluding high income)Latin America & the Caribbean (IDA & IBRD countries)LatviaLeast developed countries: UN classificationLebanonLesothoLiberiaLiechtensteinLithuaniaLow & middle incomeLow incomeLower middle incomeLuxembourgMacao SAR, ChinaMacedonia, FYRMadagascarMalawiMalaysiaMaldivesMaliMaltaMarshall IslandsMauritaniaMauritiusMexicoMicronesia, Fed. Sts.Middle East & North AfricaMiddle East & North Africa (excluding high income)Middle East & North Africa (IDA & IBRD countries)Middle incomeMoldovaMongoliaMontenegroMoroccoMozambiqueMyanmarNamibiaNepalNetherlandsNew ZealandNicaraguaNigerNigeriaNorth AmericaNorwayOECD membersOmanOther small statesPacific island small statesPakistanPalauPanamaParaguayPeruPhilippinesPolandPortugalPost-demographic dividendPre-demographic dividendPuerto RicoQatarRomaniaRussian FederationRwandaSamoaSao Tome and PrincipeSaudi ArabiaSenegalSerbiaSeychellesSierra LeoneSingaporeSlovak RepublicSloveniaSmall statesSouth AfricaSouth AsiaSouth Asia (IDA & IBRD)SpainSri LankaSt. Kitts and NevisSt. LuciaSt. Vincent and the GrenadinesSub-Saharan Africa Sub-Saharan Africa (excluding high income)Sub-Saharan Africa (IDA & IBRD countries)SudanSurinameSwazilandSwedenSwitzerlandTajikistanTanzaniaThailandTimor-LesteTogoTongaTrinidad and TobagoTunisiaTurkeyTurkmenistanTuvaluUgandaUkraineUnited Arab EmiratesUnited KingdomUnited StatesUpper middle incomeUruguayUzbekistanVanuatuVenezuela, RBVietnamWest Bank and GazaWorldYemen, Rep.ZambiaZimbabwe Zeitlinie:
Diese Zeitleiste vorliegt die Graphik ab 1961 J. bis 2016 J. China. Die Angaben bis 1960 J. sind nicht vorhanden. Die Zahl aktueller Beobachtungen nach Daten: 56.
Die Quelle (Bezeichnung):
Kennzahlen der Weltentwicklung
Die Quelle (Einrichtung):
World Bank national accounts data, and OECD National Accounts data files.
Kategorien:
Economy & Growth
Es wurde aktualisiert:
23 Apr 2017 Jahr
Kennzahlen der Wertänderungen vom Jahr zum Jahr
im Durchschnitt:
810.506 Mlrd.
Minimum:
15.061 Mlrd.
1 Jan 1963 Jahr
Maximum:
4.177 Trln
1 Jan 2016 Jahr
Zum Datum der Beobachtung
Wert
Absolute Veränderung
Die Veränderung bezüglich dem vorherigen Wert
1 Jan 1961 Jahr
28.996 Mlrd.
+28.996 Mlrd.
0.0%
1 Jan 1962 Jahr
16.846 Mlrd.
-12.149 Mlrd.
-41.9%
1 Jan 1963 Jahr
15.061 Mlrd.
-1.786 Mlrd.
-10.6%
1 Jan 1964 Jahr
17.245 Mlrd.
+2.184 Mlrd.
14.5%
1 Jan 1965 Jahr
21.642 Mlrd.
+4.397 Mlrd.
25.5%
1 Jan 1966 Jahr
26.836 Mlrd.
+5.194 Mlrd.
24.0%
1 Jan 1967 Jahr
32.793 Mlrd.
+5.958 Mlrd.
22.2%
1 Jan 1968 Jahr
28.104 Mlrd.
-4.689 Mlrd.
-14.3%
1 Jan 1969 Jahr
25.518 Mlrd.
-2.586 Mlrd.
-9.2%
1 Jan 1970 Jahr
33.94 Mlrd.
+8.421 Mlrd.
33.0%
1 Jan 1971 Jahr
45.683 Mlrd.
+11.743 Mlrd.
34.6%
1 Jan 1972 Jahr
51.347 Mlrd.
+5.665 Mlrd.
12.4%
1 Jan 1973 Jahr
54.788 Mlrd.
+3.44 Mlrd.
6.7%
1 Jan 1974 Jahr
59.335 Mlrd.
+4.547 Mlrd.
8.3%
1 Jan 1975 Jahr
60.166 Mlrd.
+830.689 Mln.
1.4%
1 Jan 1976 Jahr
69.612 Mlrd.
+9.446 Mlrd.
15.7%
1 Jan 1977 Jahr
67.941 Mlrd.
-1.671 Mlrd.
-2.4%
1 Jan 1978 Jahr
76.909 Mlrd.
+8.968 Mlrd.
13.2%
1 Jan 1979 Jahr
88.471 Mlrd.
+11.562 Mlrd.
15.03%
1 Jan 1980 Jahr
95.725 Mlrd.
+7.255 Mlrd.
8.2%
1 Jan 1981 Jahr
108.642 Mlrd.
+12.917 Mlrd.
13.49%
1 Jan 1982 Jahr
110.677 Mlrd.
+2.035 Mlrd.
1.87%
1 Jan 1983 Jahr
116.87 Mlrd.
+6.193 Mlrd.
5.6%
1 Jan 1984 Jahr
128.99 Mlrd.
+12.121 Mlrd.
10.37%
1 Jan 1985 Jahr
147.658 Mlrd.
+18.667 Mlrd.
14.47%
1 Jan 1986 Jahr
174.818 Mlrd.
+27.161 Mlrd.
18.39%
1 Jan 1987 Jahr
192.689 Mlrd.
+17.871 Mlrd.
10.22%
1 Jan 1988 Jahr
218.877 Mlrd.
+26.187 Mlrd.
13.59%
1 Jan 1989 Jahr
250.196 Mlrd.
+31.319 Mlrd.
14.31%
1 Jan 1990 Jahr
259.573 Mlrd.
+9.378 Mlrd.
3.75%
1 Jan 1991 Jahr
267.89 Mlrd.
+8.316 Mlrd.
3.2%
1 Jan 1992 Jahr
304.782 Mlrd.
+36.892 Mlrd.
13.77%
1 Jan 1993 Jahr
368.835 Mlrd.
+64.053 Mlrd.
21.02%
1 Jan 1994 Jahr
441.735 Mlrd.
+72.9 Mlrd.
19.76%
1 Jan 1995 Jahr
521.801 Mlrd.
+80.066 Mlrd.
18.13%
1 Jan 1996 Jahr
593.993 Mlrd.
+72.192 Mlrd.
13.84%
1 Jan 1997 Jahr
665.832 Mlrd.
+71.838 Mlrd.
12.09%
1 Jan 1998 Jahr
735.547 Mlrd.
+69.715 Mlrd.
10.47%
1 Jan 1999 Jahr
801.103 Mlrd.
+65.557 Mlrd.
8.91%
1 Jan 2000 Jahr
866.749 Mlrd.
+65.645 Mlrd.
8.19%
1 Jan 2001 Jahr
948.938 Mlrd.
+82.189 Mlrd.
9.48%
1 Jan 2002 Jahr
1.029 Trln
+80.508 Mlrd.
8.48%
1 Jan 2003 Jahr
1.131 Trln
+101.918 Mlrd.
9.9%
1 Jan 2004 Jahr
1.275 Trln
+143.323 Mlrd.
12.67%
1 Jan 2005 Jahr
1.417 Trln
+141.996 Mlrd.
11.14%
1 Jan 2006 Jahr
1.589 Trln
+171.899 Mlrd.
12.13%
1 Jan 2007 Jahr
1.802 Trln
+213.657 Mlrd.
13.45%
1 Jan 2008 Jahr
2.073 Trln
+271.252 Mlrd.
15.05%
1 Jan 2009 Jahr
2.278 Trln
+204.014 Mlrd.
9.84%
1 Jan 2010 Jahr
2.512 Trln
+234.359 Mlrd.
10.29%
1 Jan 2011 Jahr
2.83 Trln
+318.584 Mlrd.
12.68%
1 Jan 2012 Jahr
3.133 Trln
+302.57 Mlrd.
10.69%
1 Jan 2013 Jahr
3.395 Trln
+262.051 Mlrd.
8.36%
1 Jan 2014 Jahr
3.666 Trln
+271.163 Mlrd.
7.99%
1 Jan 2015 Jahr
3.937 Trln
+271.075 Mlrd.
7.39%
1 Jan 2016 Jahr
4.177 Trln
+239.933 Mlrd.
6.09%
Bewertung der Länder gemäß mit laufender Statistik nach Jahren


Kommentare: