29
/de/
de
AIzaSyAYiBZKx7MnpbEhh9jyipgxe19OcubqV5w
April 1, 2024
61699
Upper middle income
UMC
false
2
1
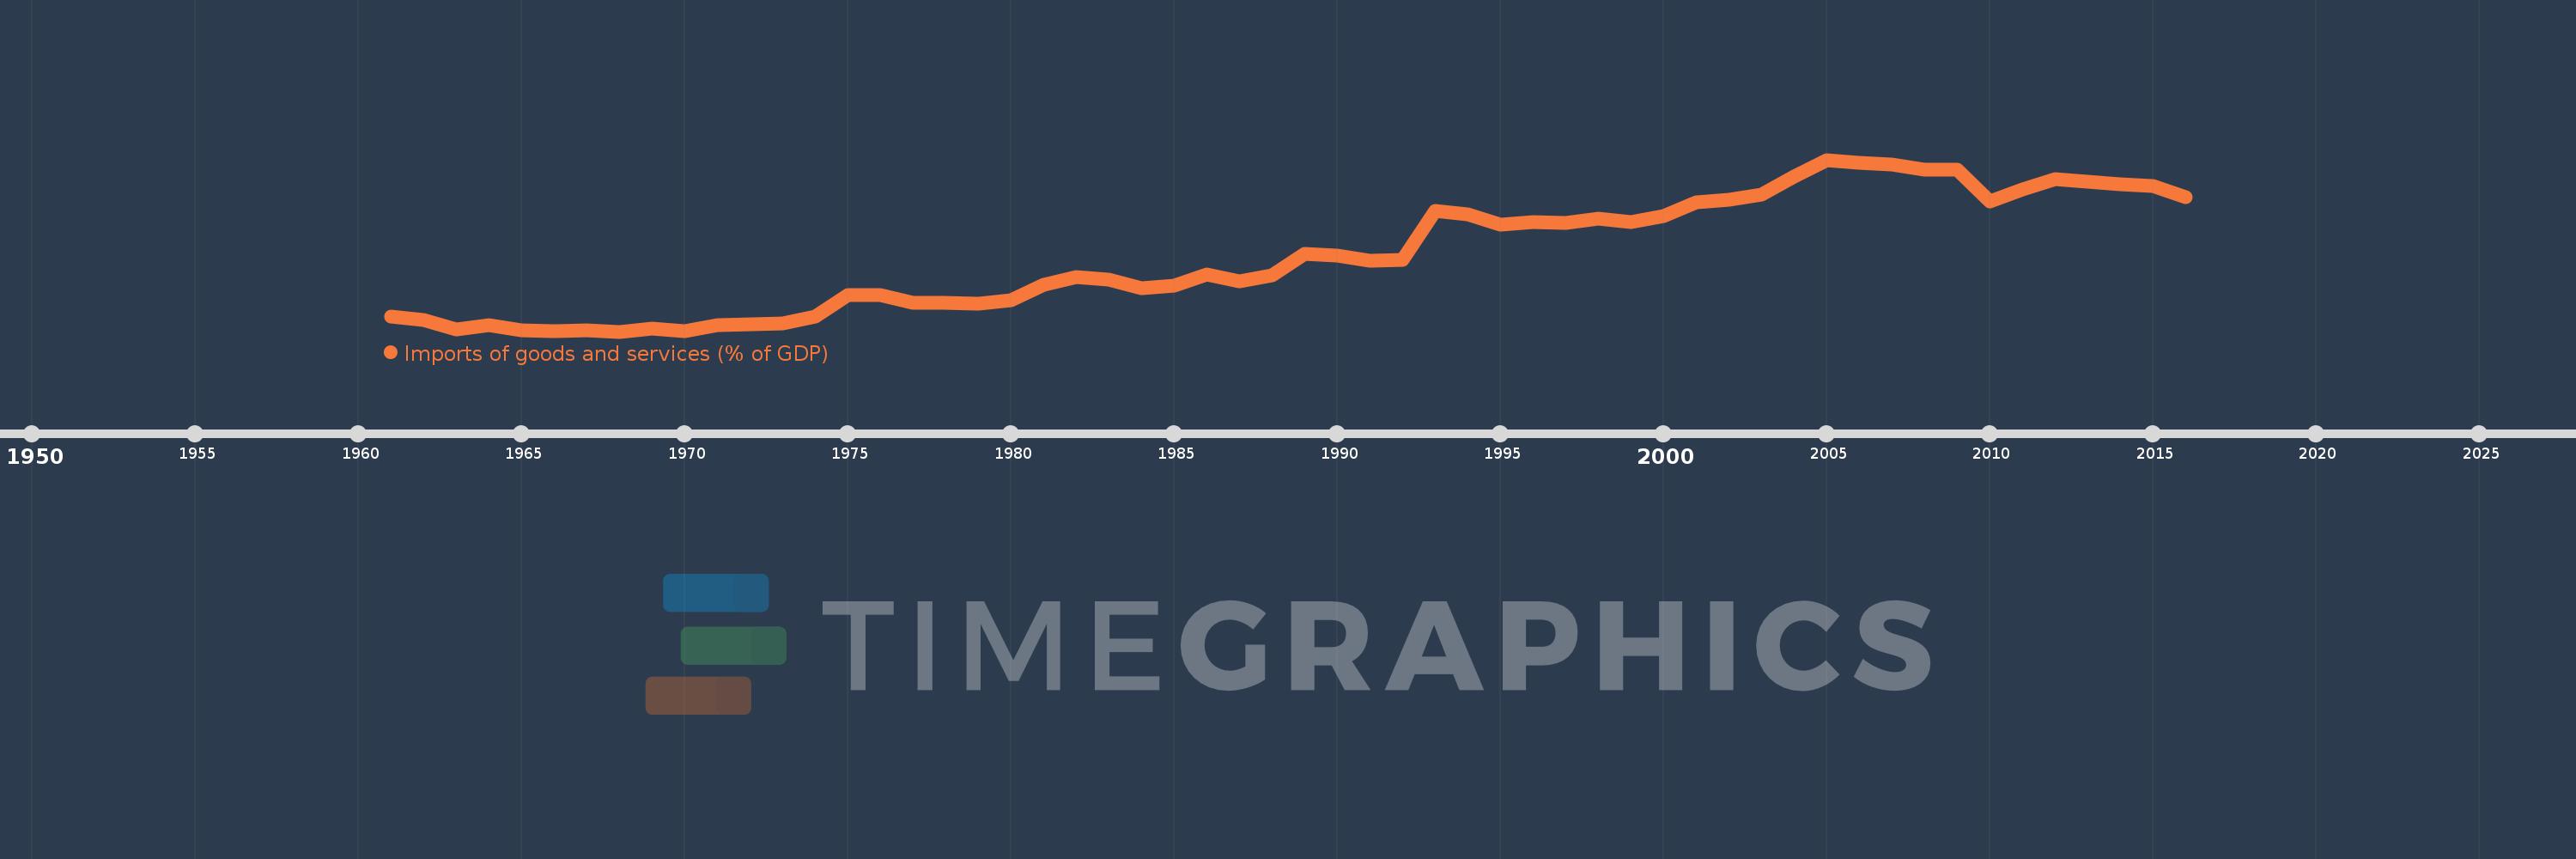
Imports of goods and services (% of GDP)
2016,2015,2014,2013,2012,2011,2010,2009,2008,2007,2006,2005,2004,2003,2002,2001,2000,1999,1998,1997,1996,1995,1994,1993,1992,1991,1990,1989,1988,1987,1986,1985,1984,1983,1982,1981,1980,1979,1978,1977,1976,1975,1974,1973,1972,1971,1970,1969,1968,1967,1966,1965,1964,1963,1962,1961
Diese Statistik in anderen Ländern:
AfghanistanAlbaniaAlgeriaAngolaAntigua and BarbudaArab WorldArgentinaArmeniaArubaAustraliaAustriaAzerbaijanBahamas, TheBahrainBangladeshBarbadosBelarusBelgiumBelizeBeninBermudaBhutanBoliviaBosnia and HerzegovinaBotswanaBrazilBrunei DarussalamBulgariaBurkina FasoBurundiCabo VerdeCambodiaCameroonCanadaCaribbean small statesCentral African RepublicCentral Europe and the BalticsChadChileChinaColombiaComorosCongo, Dem. Rep.Congo, Rep.Costa RicaCote d'IvoireCroatiaCubaCyprusCzech RepublicDenmarkDjiboutiDominicaDominican RepublicEarly-demographic dividendEast Asia & PacificEast Asia & Pacific (excluding high income)East Asia & Pacific (IDA & IBRD countries)EcuadorEgypt, Arab Rep.El SalvadorEquatorial GuineaEritreaEstoniaEthiopiaEuro areaEurope & Central AsiaEurope & Central Asia (excluding high income)Europe & Central Asia (IDA & IBRD countries)European UnionFaroe IslandsFijiFinlandFragile and conflict affected situationsFranceFrench PolynesiaGabonGambia, TheGeorgiaGermanyGhanaGreeceGrenadaGuatemalaGuineaGuinea-BissauGuyanaHaitiHeavily indebted poor countries (HIPC)High incomeHondurasHong Kong SAR, ChinaHungaryIBRD onlyIcelandIDA & IBRD totalIDA blendIDA onlyIDA totalIndiaIndonesiaIran, Islamic Rep.IraqIrelandIsraelItalyJamaicaJapanJordanKazakhstanKenyaKiribatiKorea, Rep.KosovoKuwaitKyrgyz RepublicLao PDRLate-demographic dividendLatin America & Caribbean Latin America & Caribbean (excluding high income)Latin America & the Caribbean (IDA & IBRD countries)LatviaLeast developed countries: UN classificationLebanonLesothoLiberiaLibyaLithuaniaLow & middle incomeLow incomeLower middle incomeLuxembourgMacao SAR, ChinaMacedonia, FYRMadagascarMalawiMalaysiaMaldivesMaliMaltaMauritaniaMauritiusMexicoMicronesia, Fed. Sts.Middle East & North AfricaMiddle East & North Africa (excluding high income)Middle East & North Africa (IDA & IBRD countries)Middle incomeMoldovaMongoliaMontenegroMoroccoMozambiqueMyanmarNamibiaNepalNetherlandsNew CaledoniaNew ZealandNicaraguaNigerNigeriaNorth AmericaNorwayOECD membersOmanOther small statesPacific island small statesPakistanPalauPanamaPapua New GuineaParaguayPeruPhilippinesPolandPortugalPost-demographic dividendPre-demographic dividendPuerto RicoQatarRomaniaRussian FederationRwandaSamoaSaudi ArabiaSenegalSerbiaSeychellesSierra LeoneSingaporeSlovak RepublicSloveniaSmall statesSolomon IslandsSomaliaSouth AfricaSouth AsiaSouth Asia (IDA & IBRD)South SudanSpainSri LankaSt. Kitts and NevisSt. LuciaSt. Vincent and the GrenadinesSub-Saharan Africa Sub-Saharan Africa (excluding high income)Sub-Saharan Africa (IDA & IBRD countries)SudanSurinameSwazilandSwedenSwitzerlandSyrian Arab RepublicTajikistanTanzaniaThailandTimor-LesteTogoTongaTrinidad and TobagoTunisiaTurkeyTurkmenistanUgandaUkraineUnited Arab EmiratesUnited KingdomUnited StatesUpper middle incomeUruguayUzbekistanVanuatuVenezuela, RBVietnamWest Bank and GazaWorldYemen, Rep.ZambiaZimbabwe Zeitlinie:
Diese Zeitleiste vorliegt die Graphik ab 1961 J. bis 2016 J. Upper middle income. Die Angaben bis 1960 J. sind nicht vorhanden. Die Zahl aktueller Beobachtungen nach Daten: 56.
Die Quelle (Bezeichnung):
Kennzahlen der Weltentwicklung
Die Quelle (Einrichtung):
World Bank national accounts data, and OECD National Accounts data files.
Kategorien:
Economy & Growth, Trade
Es wurde aktualisiert:
23 Apr 2017 Jahr
Kennzahlen der Wertänderungen vom Jahr zum Jahr
Minimum:
7.867
1 Jan 1968 Jahr
Maximum:
28.352
1 Jan 2005 Jahr
Zum Datum der Beobachtung
Wert
Absolute Veränderung
Die Veränderung bezüglich dem vorherigen Wert
1 Jan 1961 Jahr
9.686
+9.686
0.0%
1 Jan 1962 Jahr
9.2
-0.486
-5.01%
1 Jan 1963 Jahr
8.079
-1.121
-12.19%
1 Jan 1964 Jahr
8.608
+0.53
6.56%
1 Jan 1965 Jahr
8.036
-0.573
-6.65%
1 Jan 1966 Jahr
7.937
-0.098
-1.22%
1 Jan 1967 Jahr
7.995
+0.057
0.72%
1 Jan 1968 Jahr
7.867
-0.128
-1.6%
1 Jan 1969 Jahr
8.182
+0.315
4.01%
1 Jan 1970 Jahr
7.927
-0.255
-3.12%
1 Jan 1971 Jahr
8.624
+0.696
8.78%
1 Jan 1972 Jahr
8.71
+0.086
1.0%
1 Jan 1973 Jahr
8.878
+0.168
1.93%
1 Jan 1974 Jahr
9.651
+0.773
8.71%
1 Jan 1975 Jahr
12.26
+2.61
27.04%
1 Jan 1976 Jahr
12.188
-0.072
-0.59%
1 Jan 1977 Jahr
11.293
-0.895
-7.34%
1 Jan 1978 Jahr
11.309
+0.016
0.14%
1 Jan 1979 Jahr
11.194
-0.115
-1.02%
1 Jan 1980 Jahr
11.566
+0.372
3.32%
1 Jan 1981 Jahr
13.488
+1.923
16.62%
1 Jan 1982 Jahr
14.321
+0.833
6.17%
1 Jan 1983 Jahr
14.051
-0.27
-1.89%
1 Jan 1984 Jahr
13.005
-1.046
-7.44%
1 Jan 1985 Jahr
13.385
+0.38
2.92%
1 Jan 1986 Jahr
14.703
+1.318
9.84%
1 Jan 1987 Jahr
13.817
-0.886
-6.03%
1 Jan 1988 Jahr
14.583
+0.767
5.55%
1 Jan 1989 Jahr
17.126
+2.543
17.44%
1 Jan 1990 Jahr
16.902
-0.224
-1.31%
1 Jan 1991 Jahr
16.268
-0.634
-3.75%
1 Jan 1992 Jahr
16.427
+0.159
0.98%
1 Jan 1993 Jahr
22.255
+5.828
35.47%
1 Jan 1994 Jahr
21.826
-0.429
-1.93%
1 Jan 1995 Jahr
20.617
-1.209
-5.54%
1 Jan 1996 Jahr
20.904
+0.287
1.39%
1 Jan 1997 Jahr
20.86
-0.044
-0.21%
1 Jan 1998 Jahr
21.314
+0.455
2.18%
1 Jan 1999 Jahr
20.894
-0.421
-1.97%
1 Jan 2000 Jahr
21.603
+0.709
3.39%
1 Jan 2001 Jahr
23.314
+1.711
7.92%
1 Jan 2002 Jahr
23.585
+0.272
1.16%
1 Jan 2003 Jahr
24.165
+0.58
2.46%
1 Jan 2004 Jahr
26.377
+2.212
9.16%
1 Jan 2005 Jahr
28.352
+1.975
7.49%
1 Jan 2006 Jahr
27.964
-0.388
-1.37%
1 Jan 2007 Jahr
27.806
-0.159
-0.57%
1 Jan 2008 Jahr
27.194
-0.612
-2.2%
1 Jan 2009 Jahr
27.125
-0.069
-0.25%
1 Jan 2010 Jahr
23.385
-3.74
-13.79%
1 Jan 2011 Jahr
24.789
+1.404
6.01%
1 Jan 2012 Jahr
26.029
+1.24
5.0%
1 Jan 2013 Jahr
25.787
-0.242
-0.93%
1 Jan 2014 Jahr
25.455
-0.332
-1.29%
1 Jan 2015 Jahr
25.212
-0.243
-0.95%
1 Jan 2016 Jahr
23.88
-1.331
-5.28%
Bewertung der Länder gemäß mit laufender Statistik nach Jahren


Kommentare: