29
/de/
de
AIzaSyAYiBZKx7MnpbEhh9jyipgxe19OcubqV5w
April 1, 2024
251997
St. Vincent and the Grenadines
VCT
true
2
1
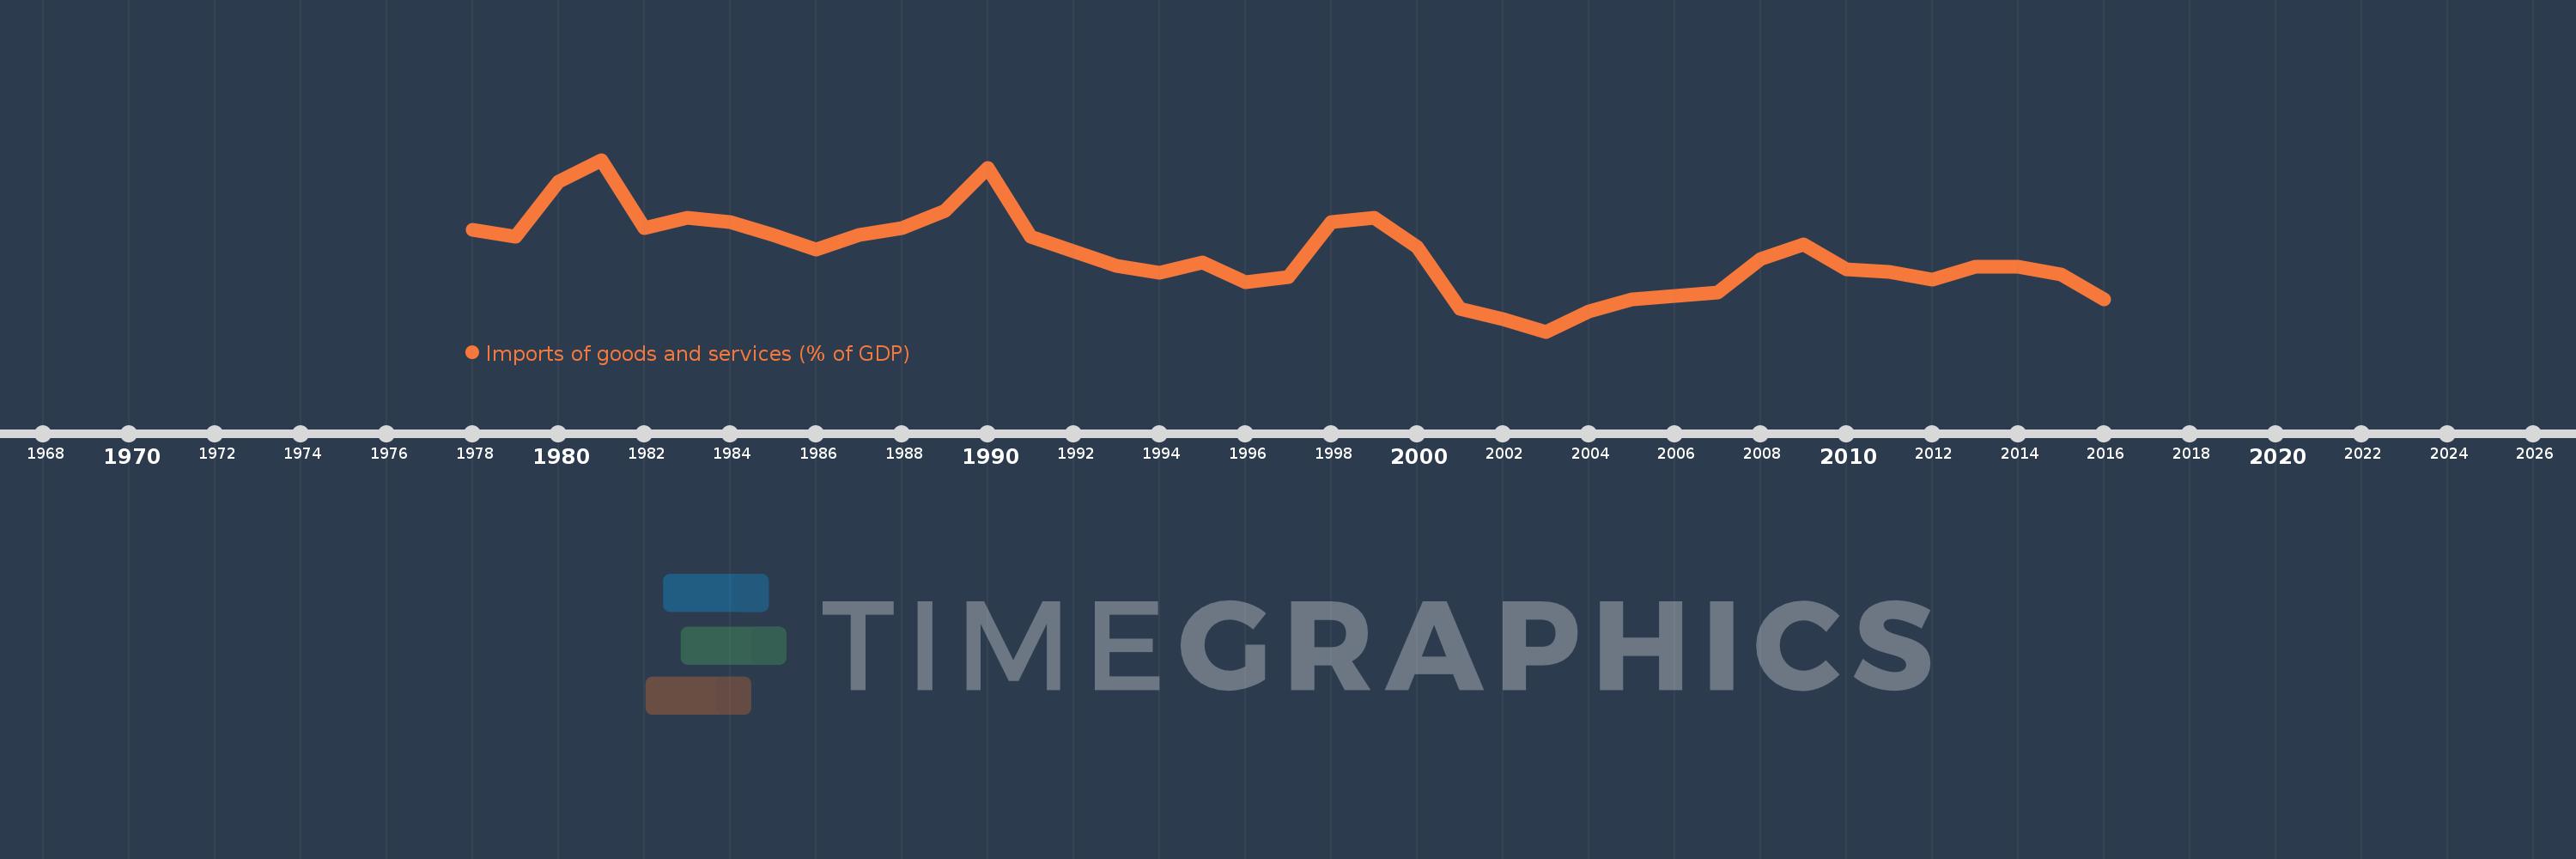
Imports of goods and services (% of GDP)
2016,2015,2014,2013,2012,2011,2010,2009,2008,2007,2006,2005,2004,2003,2002,2001,2000,1999,1998,1997,1996,1995,1994,1993,1992,1991,1990,1989,1988,1987,1986,1985,1984,1983,1982,1981,1980,1979,1978
Diese Statistik in anderen Ländern:
AfghanistanAlbaniaAlgeriaAngolaAntigua and BarbudaArab WorldArgentinaArmeniaArubaAustraliaAustriaAzerbaijanBahamas, TheBahrainBangladeshBarbadosBelarusBelgiumBelizeBeninBermudaBhutanBoliviaBosnia and HerzegovinaBotswanaBrazilBrunei DarussalamBulgariaBurkina FasoBurundiCabo VerdeCambodiaCameroonCanadaCaribbean small statesCentral African RepublicCentral Europe and the BalticsChadChileChinaColombiaComorosCongo, Dem. Rep.Congo, Rep.Costa RicaCote d'IvoireCroatiaCubaCyprusCzech RepublicDenmarkDjiboutiDominicaDominican RepublicEarly-demographic dividendEast Asia & PacificEast Asia & Pacific (excluding high income)East Asia & Pacific (IDA & IBRD countries)EcuadorEgypt, Arab Rep.El SalvadorEquatorial GuineaEritreaEstoniaEthiopiaEuro areaEurope & Central AsiaEurope & Central Asia (excluding high income)Europe & Central Asia (IDA & IBRD countries)European UnionFaroe IslandsFijiFinlandFragile and conflict affected situationsFranceFrench PolynesiaGabonGambia, TheGeorgiaGermanyGhanaGreeceGrenadaGuatemalaGuineaGuinea-BissauGuyanaHaitiHeavily indebted poor countries (HIPC)High incomeHondurasHong Kong SAR, ChinaHungaryIBRD onlyIcelandIDA & IBRD totalIDA blendIDA onlyIDA totalIndiaIndonesiaIran, Islamic Rep.IraqIrelandIsraelItalyJamaicaJapanJordanKazakhstanKenyaKiribatiKorea, Rep.KosovoKuwaitKyrgyz RepublicLao PDRLate-demographic dividendLatin America & Caribbean Latin America & Caribbean (excluding high income)Latin America & the Caribbean (IDA & IBRD countries)LatviaLeast developed countries: UN classificationLebanonLesothoLiberiaLibyaLithuaniaLow & middle incomeLow incomeLower middle incomeLuxembourgMacao SAR, ChinaMacedonia, FYRMadagascarMalawiMalaysiaMaldivesMaliMaltaMauritaniaMauritiusMexicoMicronesia, Fed. Sts.Middle East & North AfricaMiddle East & North Africa (excluding high income)Middle East & North Africa (IDA & IBRD countries)Middle incomeMoldovaMongoliaMontenegroMoroccoMozambiqueMyanmarNamibiaNepalNetherlandsNew CaledoniaNew ZealandNicaraguaNigerNigeriaNorth AmericaNorwayOECD membersOmanOther small statesPacific island small statesPakistanPalauPanamaPapua New GuineaParaguayPeruPhilippinesPolandPortugalPost-demographic dividendPre-demographic dividendPuerto RicoQatarRomaniaRussian FederationRwandaSamoaSaudi ArabiaSenegalSerbiaSeychellesSierra LeoneSingaporeSlovak RepublicSloveniaSmall statesSolomon IslandsSomaliaSouth AfricaSouth AsiaSouth Asia (IDA & IBRD)South SudanSpainSri LankaSt. Kitts and NevisSt. LuciaSt. Vincent and the GrenadinesSub-Saharan Africa Sub-Saharan Africa (excluding high income)Sub-Saharan Africa (IDA & IBRD countries)SudanSurinameSwazilandSwedenSwitzerlandSyrian Arab RepublicTajikistanTanzaniaThailandTimor-LesteTogoTongaTrinidad and TobagoTunisiaTurkeyTurkmenistanUgandaUkraineUnited Arab EmiratesUnited KingdomUnited StatesUpper middle incomeUruguayUzbekistanVanuatuVenezuela, RBVietnamWest Bank and GazaWorldYemen, Rep.ZambiaZimbabwe Zeitlinie:
Diese Zeitleiste vorliegt die Graphik ab 1978 J. bis 2016 J. St. Vincent and the Grenadines. Die Angaben bis 1977 J. sind nicht vorhanden. Die Zahl aktueller Beobachtungen nach Daten: 39.
Die Quelle (Bezeichnung):
Kennzahlen der Weltentwicklung
Die Quelle (Einrichtung):
World Bank national accounts data, and OECD National Accounts data files.
Kategorien:
Economy & Growth, Trade
Es wurde aktualisiert:
23 Apr 2017 Jahr
Kennzahlen der Wertänderungen vom Jahr zum Jahr
Minimum:
46.509
1 Jan 2003 Jahr
Maximum:
76.881
1 Jan 1981 Jahr
Zum Datum der Beobachtung
Wert
Absolute Veränderung
Die Veränderung bezüglich dem vorherigen Wert
1 Jan 1978 Jahr
64.516
+64.516
0.0%
1 Jan 1979 Jahr
63.245
-1.271
-1.97%
1 Jan 1980 Jahr
73.036
+9.791
15.48%
1 Jan 1981 Jahr
76.881
+3.845
5.26%
1 Jan 1982 Jahr
64.861
-12.019
-15.63%
1 Jan 1983 Jahr
66.648
+1.787
2.75%
1 Jan 1984 Jahr
65.882
-0.766
-1.15%
1 Jan 1985 Jahr
63.538
-2.344
-3.56%
1 Jan 1986 Jahr
61.012
-2.526
-3.98%
1 Jan 1987 Jahr
63.647
+2.635
4.32%
1 Jan 1988 Jahr
64.818
+1.171
1.84%
1 Jan 1989 Jahr
67.896
+3.078
4.75%
1 Jan 1990 Jahr
75.393
+7.498
11.04%
1 Jan 1991 Jahr
63.348
-12.045
-15.98%
1 Jan 1992 Jahr
60.774
-2.574
-4.06%
1 Jan 1993 Jahr
58.171
-2.603
-4.28%
1 Jan 1994 Jahr
56.905
-1.267
-2.18%
1 Jan 1995 Jahr
58.759
+1.854
3.26%
1 Jan 1996 Jahr
55.224
-3.535
-6.02%
1 Jan 1997 Jahr
56.197
+0.974
1.76%
1 Jan 1998 Jahr
65.833
+9.636
17.15%
1 Jan 1999 Jahr
66.649
+0.816
1.24%
1 Jan 2000 Jahr
61.418
-5.232
-7.85%
1 Jan 2001 Jahr
50.589
-10.828
-17.63%
1 Jan 2002 Jahr
48.707
-1.883
-3.72%
1 Jan 2003 Jahr
46.509
-2.197
-4.51%
1 Jan 2004 Jahr
50.102
+3.592
7.72%
1 Jan 2005 Jahr
52.147
+2.046
4.08%
1 Jan 2006 Jahr
52.874
+0.727
1.39%
1 Jan 2007 Jahr
53.351
+0.476
0.9%
1 Jan 2008 Jahr
59.281
+5.93
11.12%
1 Jan 2009 Jahr
61.95
+2.669
4.5%
1 Jan 2010 Jahr
57.495
-4.455
-7.19%
1 Jan 2011 Jahr
57.129
-0.366
-0.64%
1 Jan 2012 Jahr
55.702
-1.427
-2.5%
1 Jan 2013 Jahr
57.927
+2.225
3.99%
1 Jan 2014 Jahr
58.016
+0.089
0.15%
1 Jan 2015 Jahr
56.582
-1.434
-2.47%
1 Jan 2016 Jahr
52.247
-4.335
-7.66%
Bewertung der Länder gemäß mit laufender Statistik nach Jahren


Kommentare: