29
/de/
de
AIzaSyAYiBZKx7MnpbEhh9jyipgxe19OcubqV5w
April 1, 2024
59580
Sub-Saharan Africa (excluding high income)
SSA
false
2
1
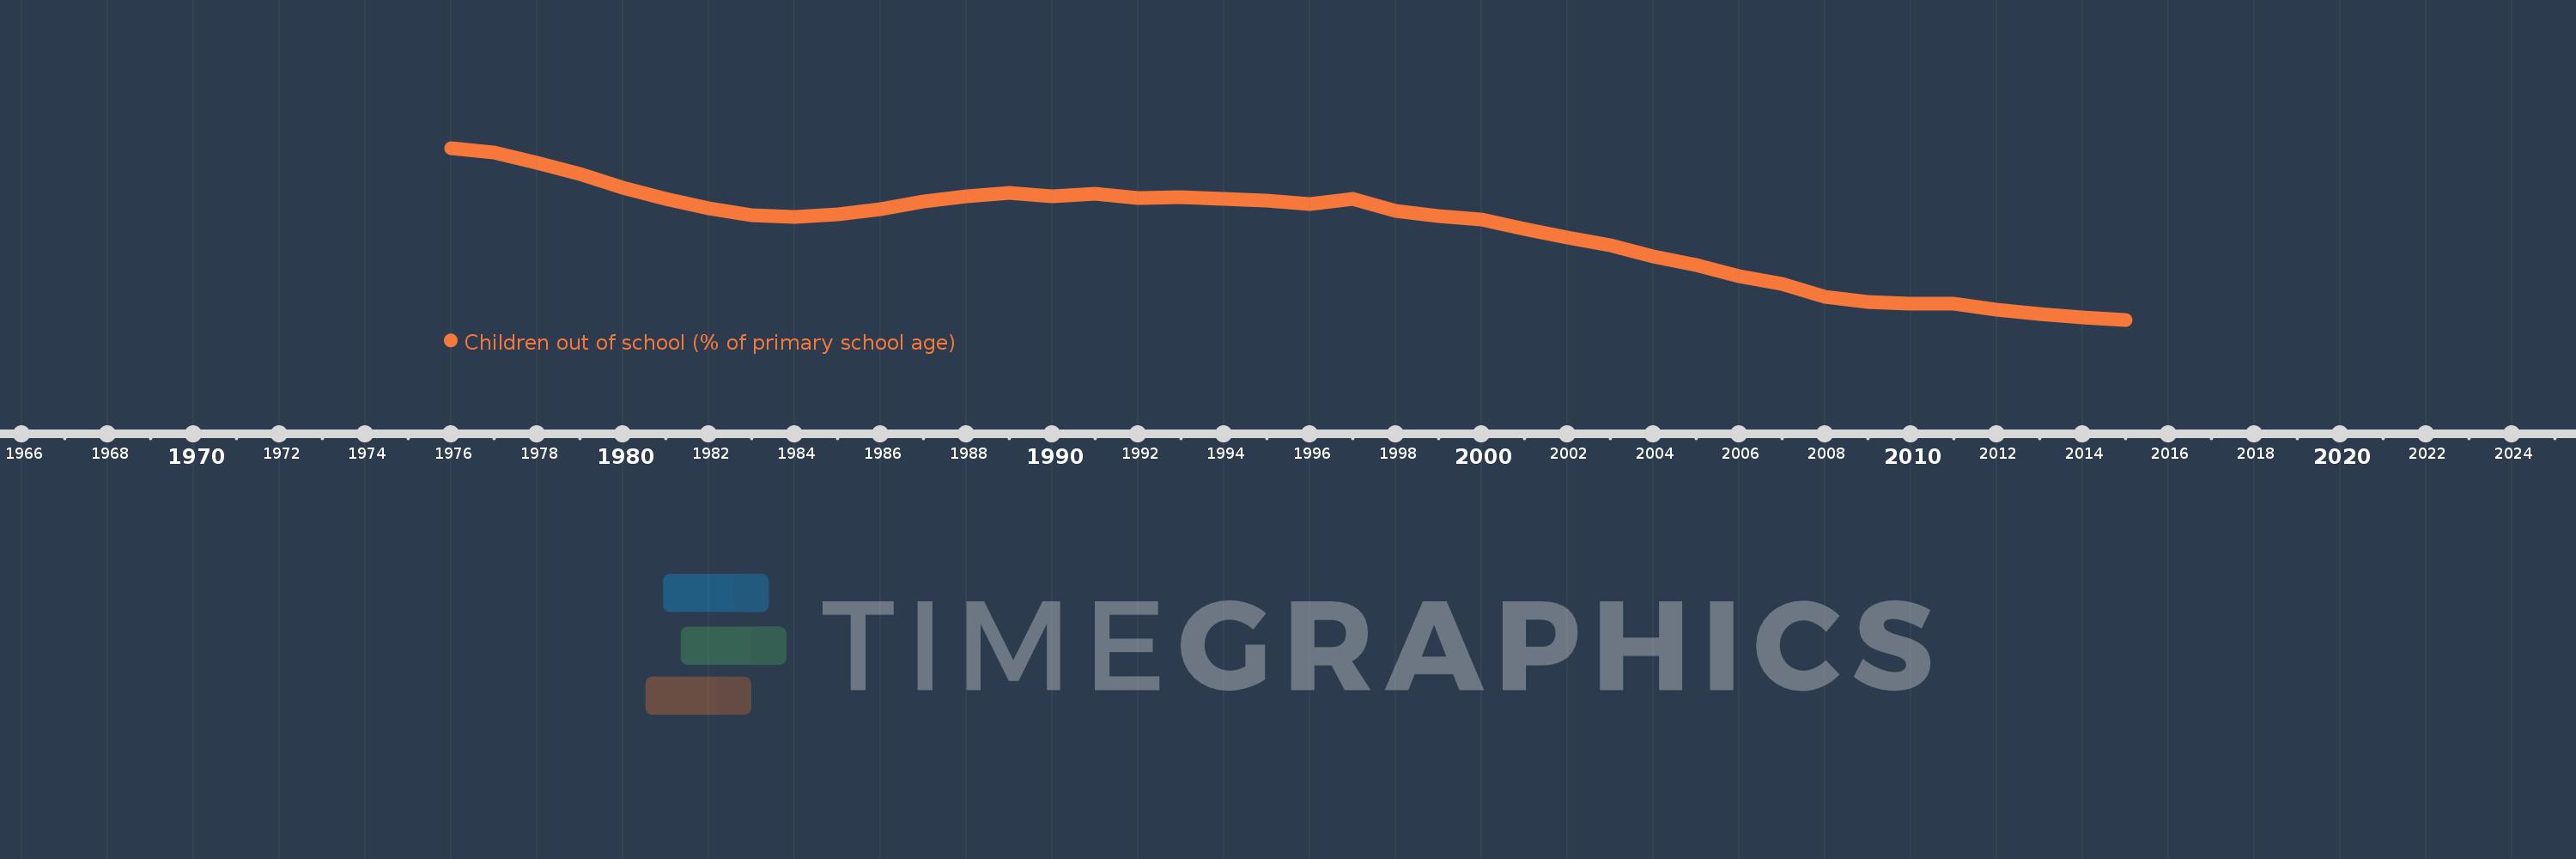
Children out of school (% of primary school age)
2015,2014,2013,2012,2011,2010,2009,2008,2007,2006,2005,2004,2003,2002,2001,2000,1999,1998,1997,1996,1995,1994,1993,1992,1991,1990,1989,1988,1987,1986,1985,1984,1983,1982,1981,1980,1979,1978,1977,1976
Diese Statistik in anderen Ländern:
AfghanistanAlbaniaAlgeriaAngolaAntigua and BarbudaArab WorldArgentinaArmeniaArubaAustraliaAustriaAzerbaijanBahamas, TheBahrainBangladeshBarbadosBelarusBelgiumBelizeBeninBermudaBhutanBoliviaBosnia and HerzegovinaBotswanaBrazilBrunei DarussalamBulgariaBurkina FasoBurundiCabo VerdeCambodiaCameroonCanadaCaribbean small statesCentral African RepublicCentral Europe and the BalticsChadChileChinaColombiaComorosCongo, Dem. Rep.Congo, Rep.Costa RicaCote d'IvoireCroatiaCubaCyprusDenmarkDjiboutiDominicaDominican RepublicEarly-demographic dividendEast Asia & PacificEast Asia & Pacific (excluding high income)East Asia & Pacific (IDA & IBRD countries)EcuadorEgypt, Arab Rep.El SalvadorEquatorial GuineaEritreaEstoniaEthiopiaEuro areaEurope & Central AsiaEurope & Central Asia (excluding high income)Europe & Central Asia (IDA & IBRD countries)European UnionFijiFinlandFragile and conflict affected situationsFranceGabonGambia, TheGeorgiaGermanyGhanaGreeceGrenadaGuatemalaGuineaGuinea-BissauGuyanaHaitiHeavily indebted poor countries (HIPC)High incomeHondurasHong Kong SAR, ChinaHungaryIBRD onlyIcelandIDA & IBRD totalIDA blendIDA onlyIDA totalIndiaIndonesiaIran, Islamic Rep.IraqIrelandIsraelItalyJamaicaJapanJordanKazakhstanKenyaKiribatiKorea, Dem. People’s Rep.Korea, Rep.KuwaitKyrgyz RepublicLao PDRLate-demographic dividendLatin America & Caribbean Latin America & Caribbean (excluding high income)Latin America & the Caribbean (IDA & IBRD countries)LatviaLeast developed countries: UN classificationLebanonLesothoLiberiaLibyaLiechtensteinLithuaniaLow & middle incomeLow incomeLower middle incomeLuxembourgMacao SAR, ChinaMacedonia, FYRMadagascarMalawiMalaysiaMaldivesMaliMaltaMarshall IslandsMauritaniaMauritiusMexicoMicronesia, Fed. Sts.Middle East & North AfricaMiddle East & North Africa (excluding high income)Middle East & North Africa (IDA & IBRD countries)Middle incomeMoldovaMongoliaMontenegroMoroccoMozambiqueMyanmarNamibiaNauruNepalNetherlandsNew ZealandNicaraguaNigerNigeriaNorth AmericaNorwayOECD membersOmanOther small statesPacific island small statesPakistanPalauPanamaPapua New GuineaParaguayPeruPhilippinesPolandPortugalPost-demographic dividendPre-demographic dividendPuerto RicoQatarRomaniaRussian FederationRwandaSamoaSan MarinoSao Tome and PrincipeSaudi ArabiaSenegalSerbiaSeychellesSierra LeoneSloveniaSmall statesSolomon IslandsSomaliaSouth AfricaSouth AsiaSouth Asia (IDA & IBRD)South SudanSpainSri LankaSt. Kitts and NevisSt. LuciaSt. Vincent and the GrenadinesSub-Saharan Africa Sub-Saharan Africa (excluding high income)Sub-Saharan Africa (IDA & IBRD countries)SudanSurinameSwazilandSwedenSwitzerlandSyrian Arab RepublicTajikistanTanzaniaThailandTimor-LesteTogoTongaTrinidad and TobagoTunisiaTurkeyTuvaluUgandaUkraineUnited Arab EmiratesUnited KingdomUnited StatesUpper middle incomeUruguayUzbekistanVanuatuVenezuela, RBVietnamWest Bank and GazaWorldYemen, Rep.ZambiaZimbabwe Zeitlinie:
Diese Zeitleiste vorliegt die Graphik ab 1976 J. bis 2015 J. Sub-Saharan Africa (excluding high income). Die Angaben bis 1975 J. sind nicht vorhanden. Die Zahl aktueller Beobachtungen nach Daten: 40.
Die Quelle (Bezeichnung):
Kennzahlen der Weltentwicklung
Die Quelle (Einrichtung):
United Nations Educational, Scientific, and Cultural Organization (UNESCO) Institute for Statistics.
Kategorien:
Education
Es wurde aktualisiert:
23 Apr 2017 Jahr
Kennzahlen der Wertänderungen vom Jahr zum Jahr
Minimum:
21.234
1 Jan 2015 Jahr
Maximum:
56.454
1 Jan 1976 Jahr
Zum Datum der Beobachtung
Wert
Absolute Veränderung
Die Veränderung bezüglich dem vorherigen Wert
1 Jan 1976 Jahr
56.454
+56.454
0.0%
1 Jan 1977 Jahr
55.572
-0.882
-1.56%
1 Jan 1978 Jahr
53.458
-2.114
-3.8%
1 Jan 1979 Jahr
51.185
-2.273
-4.25%
1 Jan 1980 Jahr
48.281
-2.904
-5.67%
1 Jan 1981 Jahr
46.084
-2.197
-4.55%
1 Jan 1982 Jahr
44.073
-2.011
-4.36%
1 Jan 1983 Jahr
42.686
-1.387
-3.15%
1 Jan 1984 Jahr
42.269
-0.417
-0.98%
1 Jan 1985 Jahr
42.839
+0.571
1.35%
1 Jan 1986 Jahr
43.971
+1.132
2.64%
1 Jan 1987 Jahr
45.54
+1.57
3.57%
1 Jan 1988 Jahr
46.525
+0.985
2.16%
1 Jan 1989 Jahr
47.214
+0.689
1.48%
1 Jan 1990 Jahr
46.561
-0.653
-1.38%
1 Jan 1991 Jahr
47.125
+0.564
1.21%
1 Jan 1992 Jahr
46.173
-0.951
-2.02%
1 Jan 1993 Jahr
46.388
+0.215
0.47%
1 Jan 1994 Jahr
45.948
-0.441
-0.95%
1 Jan 1995 Jahr
45.628
-0.32
-0.7%
1 Jan 1996 Jahr
44.875
-0.753
-1.65%
1 Jan 1997 Jahr
46.074
+1.199
2.67%
1 Jan 1998 Jahr
43.56
-2.514
-5.46%
1 Jan 1999 Jahr
42.486
-1.073
-2.46%
1 Jan 2000 Jahr
41.81
-0.676
-1.59%
1 Jan 2001 Jahr
39.771
-2.039
-4.88%
1 Jan 2002 Jahr
38.03
-1.741
-4.38%
1 Jan 2003 Jahr
36.494
-1.535
-4.04%
1 Jan 2004 Jahr
34.153
-2.341
-6.41%
1 Jan 2005 Jahr
32.422
-1.731
-5.07%
1 Jan 2006 Jahr
30.203
-2.219
-6.84%
1 Jan 2007 Jahr
28.497
-1.706
-5.65%
1 Jan 2008 Jahr
25.885
-2.612
-9.17%
1 Jan 2009 Jahr
24.869
-1.016
-3.92%
1 Jan 2010 Jahr
24.495
-0.374
-1.51%
1 Jan 2011 Jahr
24.539
+0.044
0.18%
1 Jan 2012 Jahr
23.349
-1.19
-4.85%
1 Jan 2013 Jahr
22.482
-0.867
-3.71%
1 Jan 2014 Jahr
21.727
-0.755
-3.36%
1 Jan 2015 Jahr
21.234
-0.494
-2.27%
Bewertung der Länder gemäß mit laufender Statistik nach Jahren


Kommentare: