29
/de/
de
AIzaSyAYiBZKx7MnpbEhh9jyipgxe19OcubqV5w
April 1, 2024
45908
Low income
LIC
false
2
1
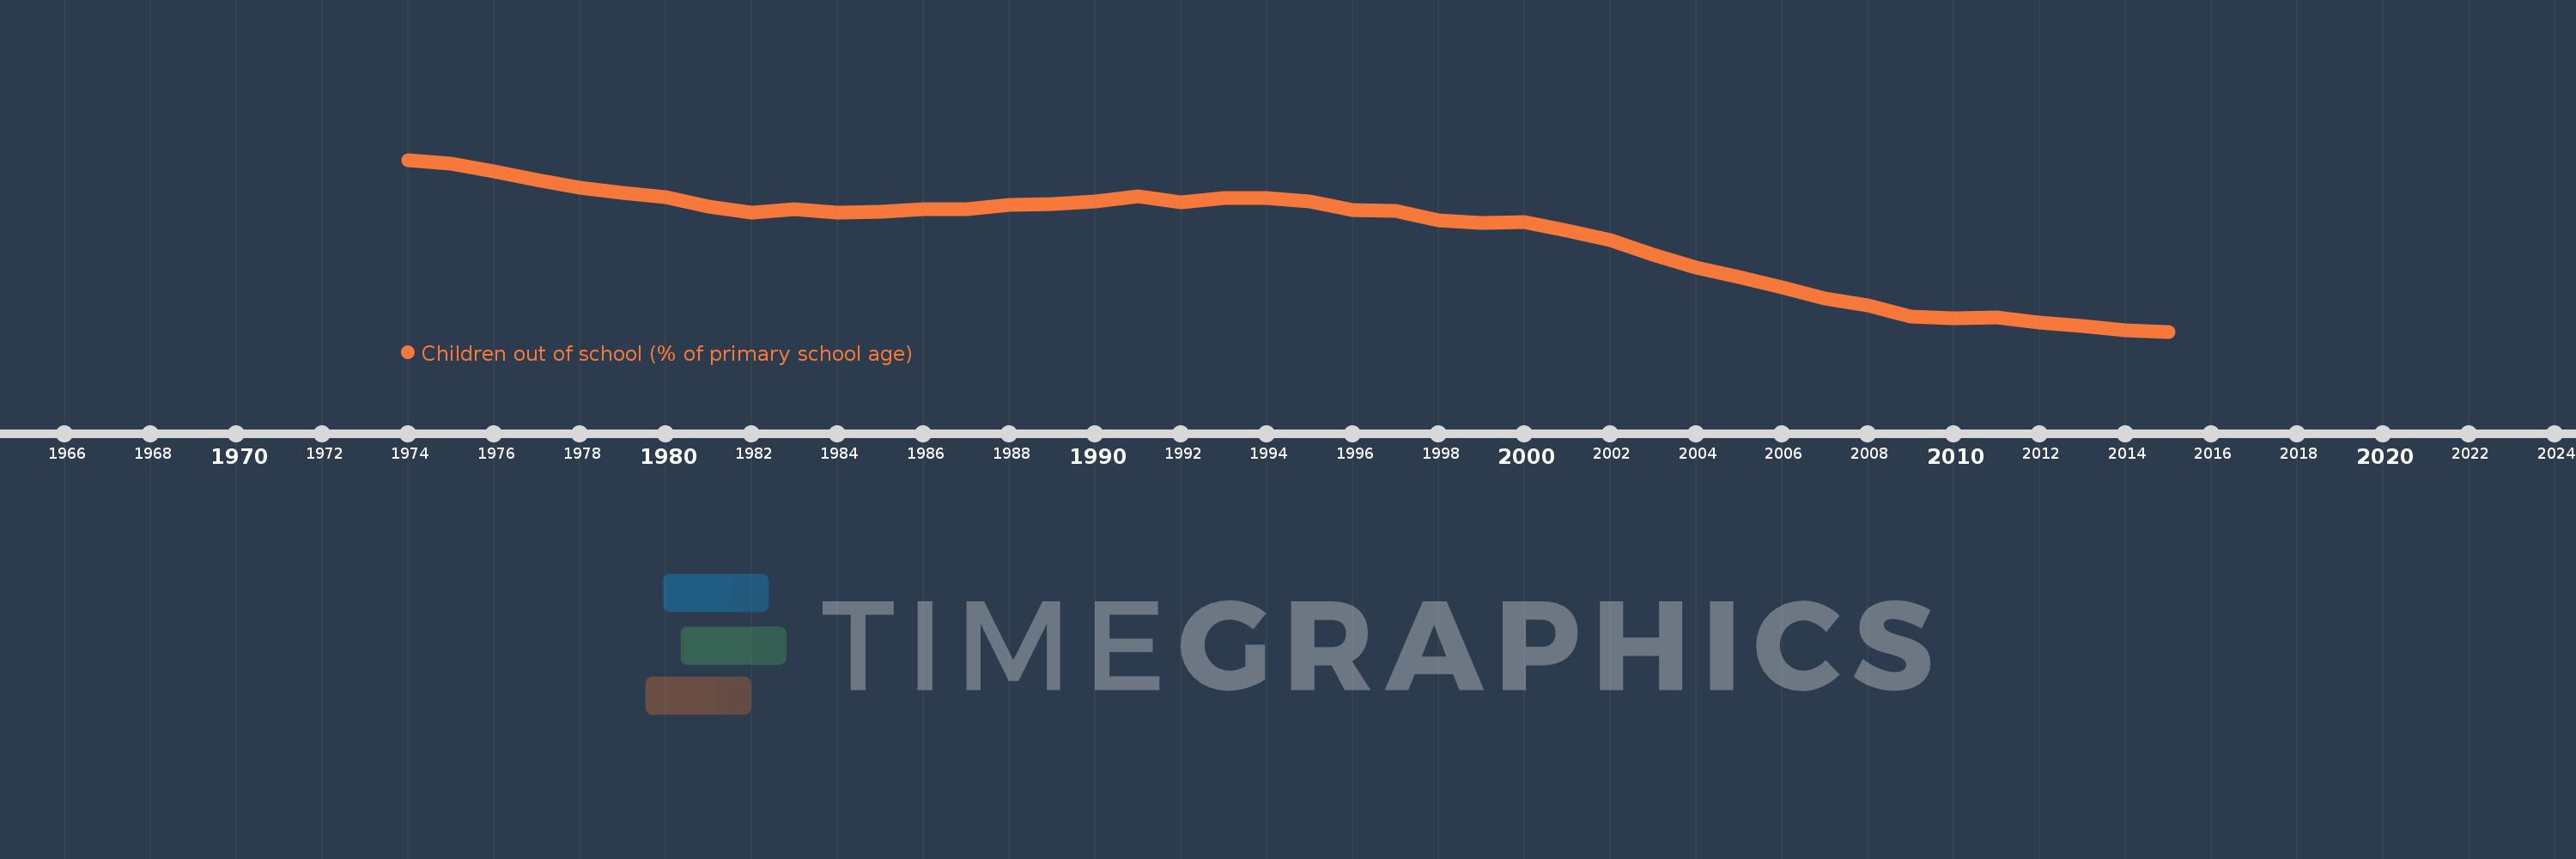
Children out of school (% of primary school age)
2015,2014,2013,2012,2011,2010,2009,2008,2007,2006,2005,2004,2003,2002,2001,2000,1999,1998,1997,1996,1995,1994,1993,1992,1991,1990,1989,1988,1987,1986,1985,1984,1983,1982,1981,1980,1979,1978,1977,1976,1975,1974
Diese Statistik in anderen Ländern:
AfghanistanAlbaniaAlgeriaAngolaAntigua and BarbudaArab WorldArgentinaArmeniaArubaAustraliaAustriaAzerbaijanBahamas, TheBahrainBangladeshBarbadosBelarusBelgiumBelizeBeninBermudaBhutanBoliviaBosnia and HerzegovinaBotswanaBrazilBrunei DarussalamBulgariaBurkina FasoBurundiCabo VerdeCambodiaCameroonCanadaCaribbean small statesCentral African RepublicCentral Europe and the BalticsChadChileChinaColombiaComorosCongo, Dem. Rep.Congo, Rep.Costa RicaCote d'IvoireCroatiaCubaCyprusDenmarkDjiboutiDominicaDominican RepublicEarly-demographic dividendEast Asia & PacificEast Asia & Pacific (excluding high income)East Asia & Pacific (IDA & IBRD countries)EcuadorEgypt, Arab Rep.El SalvadorEquatorial GuineaEritreaEstoniaEthiopiaEuro areaEurope & Central AsiaEurope & Central Asia (excluding high income)Europe & Central Asia (IDA & IBRD countries)European UnionFijiFinlandFragile and conflict affected situationsFranceGabonGambia, TheGeorgiaGermanyGhanaGreeceGrenadaGuatemalaGuineaGuinea-BissauGuyanaHaitiHeavily indebted poor countries (HIPC)High incomeHondurasHong Kong SAR, ChinaHungaryIBRD onlyIcelandIDA & IBRD totalIDA blendIDA onlyIDA totalIndiaIndonesiaIran, Islamic Rep.IraqIrelandIsraelItalyJamaicaJapanJordanKazakhstanKenyaKiribatiKorea, Dem. People’s Rep.Korea, Rep.KuwaitKyrgyz RepublicLao PDRLate-demographic dividendLatin America & Caribbean Latin America & Caribbean (excluding high income)Latin America & the Caribbean (IDA & IBRD countries)LatviaLeast developed countries: UN classificationLebanonLesothoLiberiaLibyaLiechtensteinLithuaniaLow & middle incomeLow incomeLower middle incomeLuxembourgMacao SAR, ChinaMacedonia, FYRMadagascarMalawiMalaysiaMaldivesMaliMaltaMarshall IslandsMauritaniaMauritiusMexicoMicronesia, Fed. Sts.Middle East & North AfricaMiddle East & North Africa (excluding high income)Middle East & North Africa (IDA & IBRD countries)Middle incomeMoldovaMongoliaMontenegroMoroccoMozambiqueMyanmarNamibiaNauruNepalNetherlandsNew ZealandNicaraguaNigerNigeriaNorth AmericaNorwayOECD membersOmanOther small statesPacific island small statesPakistanPalauPanamaPapua New GuineaParaguayPeruPhilippinesPolandPortugalPost-demographic dividendPre-demographic dividendPuerto RicoQatarRomaniaRussian FederationRwandaSamoaSan MarinoSao Tome and PrincipeSaudi ArabiaSenegalSerbiaSeychellesSierra LeoneSloveniaSmall statesSolomon IslandsSomaliaSouth AfricaSouth AsiaSouth Asia (IDA & IBRD)South SudanSpainSri LankaSt. Kitts and NevisSt. LuciaSt. Vincent and the GrenadinesSub-Saharan Africa Sub-Saharan Africa (excluding high income)Sub-Saharan Africa (IDA & IBRD countries)SudanSurinameSwazilandSwedenSwitzerlandSyrian Arab RepublicTajikistanTanzaniaThailandTimor-LesteTogoTongaTrinidad and TobagoTunisiaTurkeyTuvaluUgandaUkraineUnited Arab EmiratesUnited KingdomUnited StatesUpper middle incomeUruguayUzbekistanVanuatuVenezuela, RBVietnamWest Bank and GazaWorldYemen, Rep.ZambiaZimbabwe Zeitlinie:
Diese Zeitleiste vorliegt die Graphik ab 1974 J. bis 2015 J. Low income. Die Angaben bis 1973 J. sind nicht vorhanden. Die Zahl aktueller Beobachtungen nach Daten: 42.
Die Quelle (Bezeichnung):
Kennzahlen der Weltentwicklung
Die Quelle (Einrichtung):
United Nations Educational, Scientific, and Cultural Organization (UNESCO) Institute for Statistics.
Kategorien:
Education
Es wurde aktualisiert:
23 Apr 2017 Jahr
Kennzahlen der Wertänderungen vom Jahr zum Jahr
Minimum:
19.08
1 Jan 2015 Jahr
Maximum:
64.091
1 Jan 1974 Jahr
Zum Datum der Beobachtung
Wert
Absolute Veränderung
Die Veränderung bezüglich dem vorherigen Wert
1 Jan 1974 Jahr
64.091
+64.091
0.0%
1 Jan 1975 Jahr
62.991
-1.1
-1.72%
1 Jan 1976 Jahr
61.025
-1.966
-3.12%
1 Jan 1977 Jahr
58.814
-2.211
-3.62%
1 Jan 1978 Jahr
56.804
-2.01
-3.42%
1 Jan 1979 Jahr
55.384
-1.419
-2.5%
1 Jan 1980 Jahr
54.225
-1.16
-2.09%
1 Jan 1981 Jahr
51.727
-2.497
-4.61%
1 Jan 1982 Jahr
50.26
-1.467
-2.84%
1 Jan 1983 Jahr
51.077
+0.817
1.62%
1 Jan 1984 Jahr
50.21
-0.867
-1.7%
1 Jan 1985 Jahr
50.586
+0.376
0.75%
1 Jan 1986 Jahr
51.071
+0.485
0.96%
1 Jan 1987 Jahr
51.116
+0.045
0.09%
1 Jan 1988 Jahr
52.355
+1.24
2.43%
1 Jan 1989 Jahr
52.393
+0.037
0.07%
1 Jan 1990 Jahr
53.182
+0.789
1.51%
1 Jan 1991 Jahr
54.443
+1.261
2.37%
1 Jan 1992 Jahr
53.045
-1.398
-2.57%
1 Jan 1993 Jahr
54.03
+0.985
1.86%
1 Jan 1994 Jahr
54.124
+0.094
0.17%
1 Jan 1995 Jahr
53.135
-0.989
-1.83%
1 Jan 1996 Jahr
50.926
-2.209
-4.16%
1 Jan 1997 Jahr
50.799
-0.127
-0.25%
1 Jan 1998 Jahr
48.225
-2.575
-5.07%
1 Jan 1999 Jahr
47.651
-0.574
-1.19%
1 Jan 2000 Jahr
47.774
+0.123
0.26%
1 Jan 2001 Jahr
45.61
-2.164
-4.53%
1 Jan 2002 Jahr
43.09
-2.519
-5.52%
1 Jan 2003 Jahr
39.204
-3.886
-9.02%
1 Jan 2004 Jahr
35.894
-3.31
-8.44%
1 Jan 2005 Jahr
33.271
-2.623
-7.31%
1 Jan 2006 Jahr
30.653
-2.618
-7.87%
1 Jan 2007 Jahr
27.736
-2.918
-9.52%
1 Jan 2008 Jahr
25.869
-1.866
-6.73%
1 Jan 2009 Jahr
22.94
-2.929
-11.32%
1 Jan 2010 Jahr
22.456
-0.484
-2.11%
1 Jan 2011 Jahr
22.796
+0.339
1.51%
1 Jan 2012 Jahr
21.546
-1.25
-5.48%
1 Jan 2013 Jahr
20.569
-0.977
-4.53%
1 Jan 2014 Jahr
19.512
-1.058
-5.14%
1 Jan 2015 Jahr
19.08
-0.432
-2.21%
Bewertung der Länder gemäß mit laufender Statistik nach Jahren


Kommentare: