29
/de/
de
AIzaSyAYiBZKx7MnpbEhh9jyipgxe19OcubqV5w
April 1, 2024
56841
South Asia
SAS
false
2
1
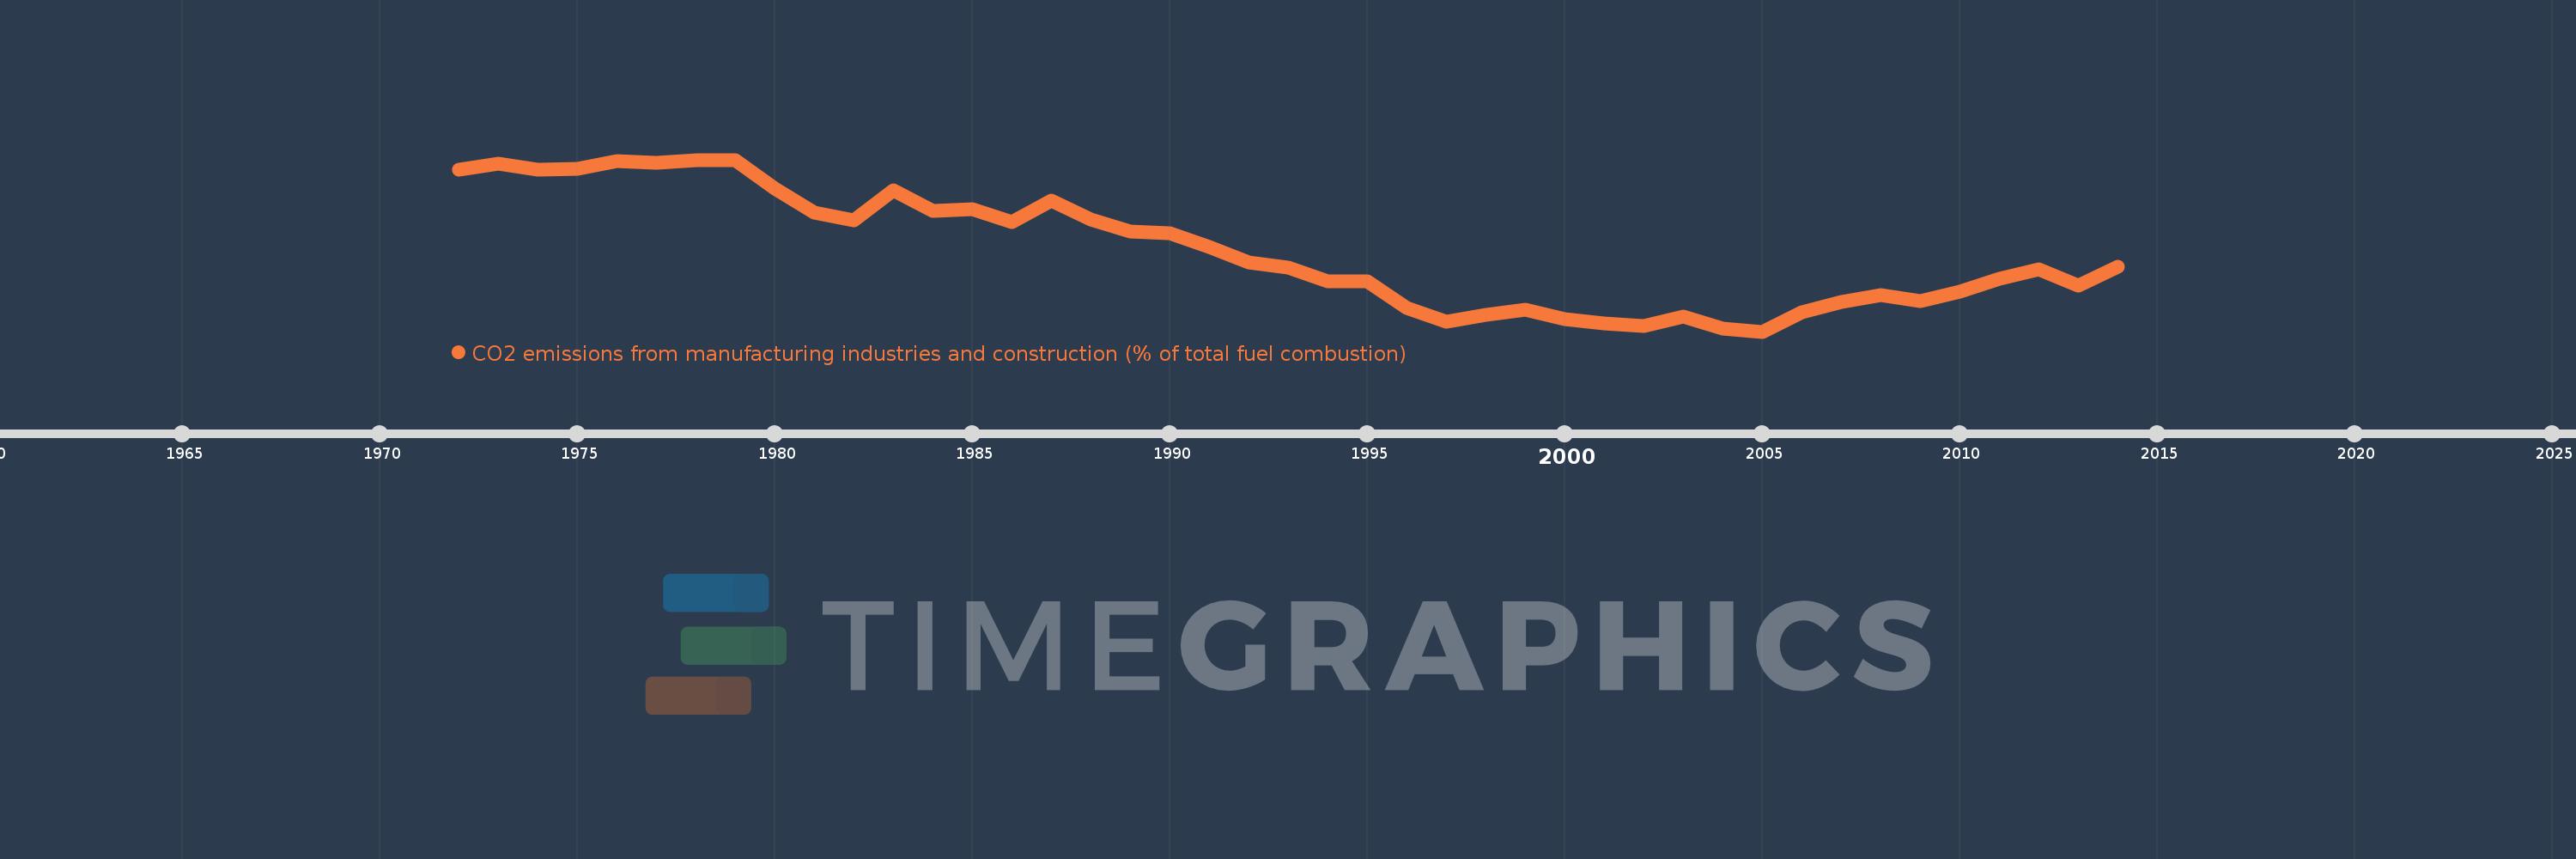
CO2 emissions from manufacturing industries and construction (% of total fuel combustion)
2014,2013,2012,2011,2010,2009,2008,2007,2006,2005,2004,2003,2002,2001,2000,1999,1998,1997,1996,1995,1994,1993,1992,1991,1990,1989,1988,1987,1986,1985,1984,1983,1982,1981,1980,1979,1978,1977,1976,1975,1974,1973,1972
Diese Statistik in anderen Ländern:
AlbaniaAlgeriaAngolaArab WorldArgentinaArmeniaAustraliaAustriaAzerbaijanBahrainBangladeshBelarusBelgiumBeninBoliviaBosnia and HerzegovinaBotswanaBrazilBrunei DarussalamBulgariaCambodiaCameroonCanadaCaribbean small statesCentral Europe and the BalticsChileChinaColombiaCongo, Dem. Rep.Congo, Rep.Costa RicaCote d'IvoireCroatiaCubaCuracaoCyprusCzech RepublicDenmarkDominican RepublicEarly-demographic dividendEast Asia & PacificEast Asia & Pacific (excluding high income)East Asia & Pacific (IDA & IBRD countries)EcuadorEgypt, Arab Rep.El SalvadorEritreaEstoniaEthiopiaEuro areaEurope & Central AsiaEurope & Central Asia (excluding high income)Europe & Central Asia (IDA & IBRD countries)European UnionFinlandFragile and conflict affected situationsFranceGabonGeorgiaGermanyGhanaGibraltarGreeceGuatemalaHaitiHeavily indebted poor countries (HIPC)High incomeHondurasHong Kong SAR, ChinaHungaryIBRD onlyIcelandIDA & IBRD totalIDA blendIDA onlyIDA totalIndiaIndonesiaIran, Islamic Rep.IraqIrelandIsraelItalyJamaicaJapanJordanKazakhstanKenyaKorea, Dem. People’s Rep.Korea, Rep.KosovoKuwaitKyrgyz RepublicLate-demographic dividendLatin America & Caribbean Latin America & Caribbean (excluding high income)Latin America & the Caribbean (IDA & IBRD countries)LatviaLeast developed countries: UN classificationLebanonLibyaLithuaniaLow & middle incomeLow incomeLower middle incomeLuxembourgMacedonia, FYRMalaysiaMaltaMauritiusMexicoMiddle East & North AfricaMiddle East & North Africa (excluding high income)Middle East & North Africa (IDA & IBRD countries)Middle incomeMoldovaMongoliaMontenegroMoroccoMozambiqueMyanmarNamibiaNepalNetherlandsNew ZealandNicaraguaNigerNigeriaNorth AmericaNorwayOECD membersOmanOther small statesPakistanPanamaParaguayPeruPhilippinesPolandPortugalPost-demographic dividendPre-demographic dividendQatarRomaniaRussian FederationSaudi ArabiaSenegalSerbiaSingaporeSlovak RepublicSloveniaSmall statesSouth AfricaSouth AsiaSouth Asia (IDA & IBRD)South SudanSpainSri LankaSub-Saharan Africa Sub-Saharan Africa (excluding high income)Sub-Saharan Africa (IDA & IBRD countries)SudanSwedenSwitzerlandSyrian Arab RepublicTajikistanTanzaniaThailandTogoTrinidad and TobagoTunisiaTurkeyTurkmenistanUkraineUnited Arab EmiratesUnited KingdomUnited StatesUpper middle incomeUruguayUzbekistanVenezuela, RBVietnamWorldYemen, Rep.ZambiaZimbabwe Zeitlinie:
Diese Zeitleiste vorliegt die Graphik ab 1972 J. bis 2014 J. South Asia. Die Angaben bis 1971 J. sind nicht vorhanden. Die Zahl aktueller Beobachtungen nach Daten: 43.
Die Quelle (Bezeichnung):
Kennzahlen der Weltentwicklung
Die Quelle (Einrichtung):
IEA Statistics © OECD/IEA 2014 (http://www.iea.org/stats/index.asp), subject to https://www.iea.org/t&c/termsandconditions/
Kategorien:
Environment
Es wurde aktualisiert:
23 Apr 2017 Jahr
Kennzahlen der Wertänderungen vom Jahr zum Jahr
Minimum:
20.377
1 Jan 2005 Jahr
Maximum:
35.308
1 Jan 1979 Jahr
Zum Datum der Beobachtung
Wert
Absolute Veränderung
Die Veränderung bezüglich dem vorherigen Wert
1 Jan 1972 Jahr
34.452
+34.452
0.0%
1 Jan 1973 Jahr
35.003
+0.551
1.6%
1 Jan 1974 Jahr
34.442
-0.561
-1.6%
1 Jan 1975 Jahr
34.532
+0.089
0.26%
1 Jan 1976 Jahr
35.198
+0.666
1.93%
1 Jan 1977 Jahr
35.077
-0.121
-0.34%
1 Jan 1978 Jahr
35.288
+0.211
0.6%
1 Jan 1979 Jahr
35.308
+0.021
0.06%
1 Jan 1980 Jahr
32.798
-2.51
-7.11%
1 Jan 1981 Jahr
30.722
-2.076
-6.33%
1 Jan 1982 Jahr
30.029
-0.693
-2.26%
1 Jan 1983 Jahr
32.653
+2.624
8.74%
1 Jan 1984 Jahr
30.832
-1.821
-5.58%
1 Jan 1985 Jahr
30.989
+0.157
0.51%
1 Jan 1986 Jahr
29.914
-1.075
-3.47%
1 Jan 1987 Jahr
31.784
+1.869
6.25%
1 Jan 1988 Jahr
30.086
-1.697
-5.34%
1 Jan 1989 Jahr
29.097
-0.989
-3.29%
1 Jan 1990 Jahr
28.929
-0.169
-0.58%
1 Jan 1991 Jahr
27.755
-1.173
-4.06%
1 Jan 1992 Jahr
26.396
-1.359
-4.9%
1 Jan 1993 Jahr
25.932
-0.464
-1.76%
1 Jan 1994 Jahr
24.715
-1.216
-4.69%
1 Jan 1995 Jahr
24.733
+0.018
0.07%
1 Jan 1996 Jahr
22.432
-2.302
-9.31%
1 Jan 1997 Jahr
21.217
-1.214
-5.41%
1 Jan 1998 Jahr
21.834
+0.616
2.9%
1 Jan 1999 Jahr
22.281
+0.447
2.05%
1 Jan 2000 Jahr
21.478
-0.803
-3.6%
1 Jan 2001 Jahr
21.096
-0.382
-1.78%
1 Jan 2002 Jahr
20.833
-0.263
-1.25%
1 Jan 2003 Jahr
21.677
+0.844
4.05%
1 Jan 2004 Jahr
20.62
-1.057
-4.87%
1 Jan 2005 Jahr
20.377
-0.244
-1.18%
1 Jan 2006 Jahr
22.067
+1.691
8.3%
1 Jan 2007 Jahr
22.95
+0.883
4.0%
1 Jan 2008 Jahr
23.543
+0.593
2.58%
1 Jan 2009 Jahr
23.033
-0.51
-2.17%
1 Jan 2010 Jahr
23.853
+0.82
3.56%
1 Jan 2011 Jahr
24.974
+1.121
4.7%
1 Jan 2012 Jahr
25.753
+0.779
3.12%
1 Jan 2013 Jahr
24.35
-1.402
-5.45%
1 Jan 2014 Jahr
26.02
+1.669
6.86%
Bewertung der Länder gemäß mit laufender Statistik nach Jahren


Kommentare: