29
/de/
de
AIzaSyAYiBZKx7MnpbEhh9jyipgxe19OcubqV5w
April 1, 2024
245334
South Africa
ZAF
true
2
1
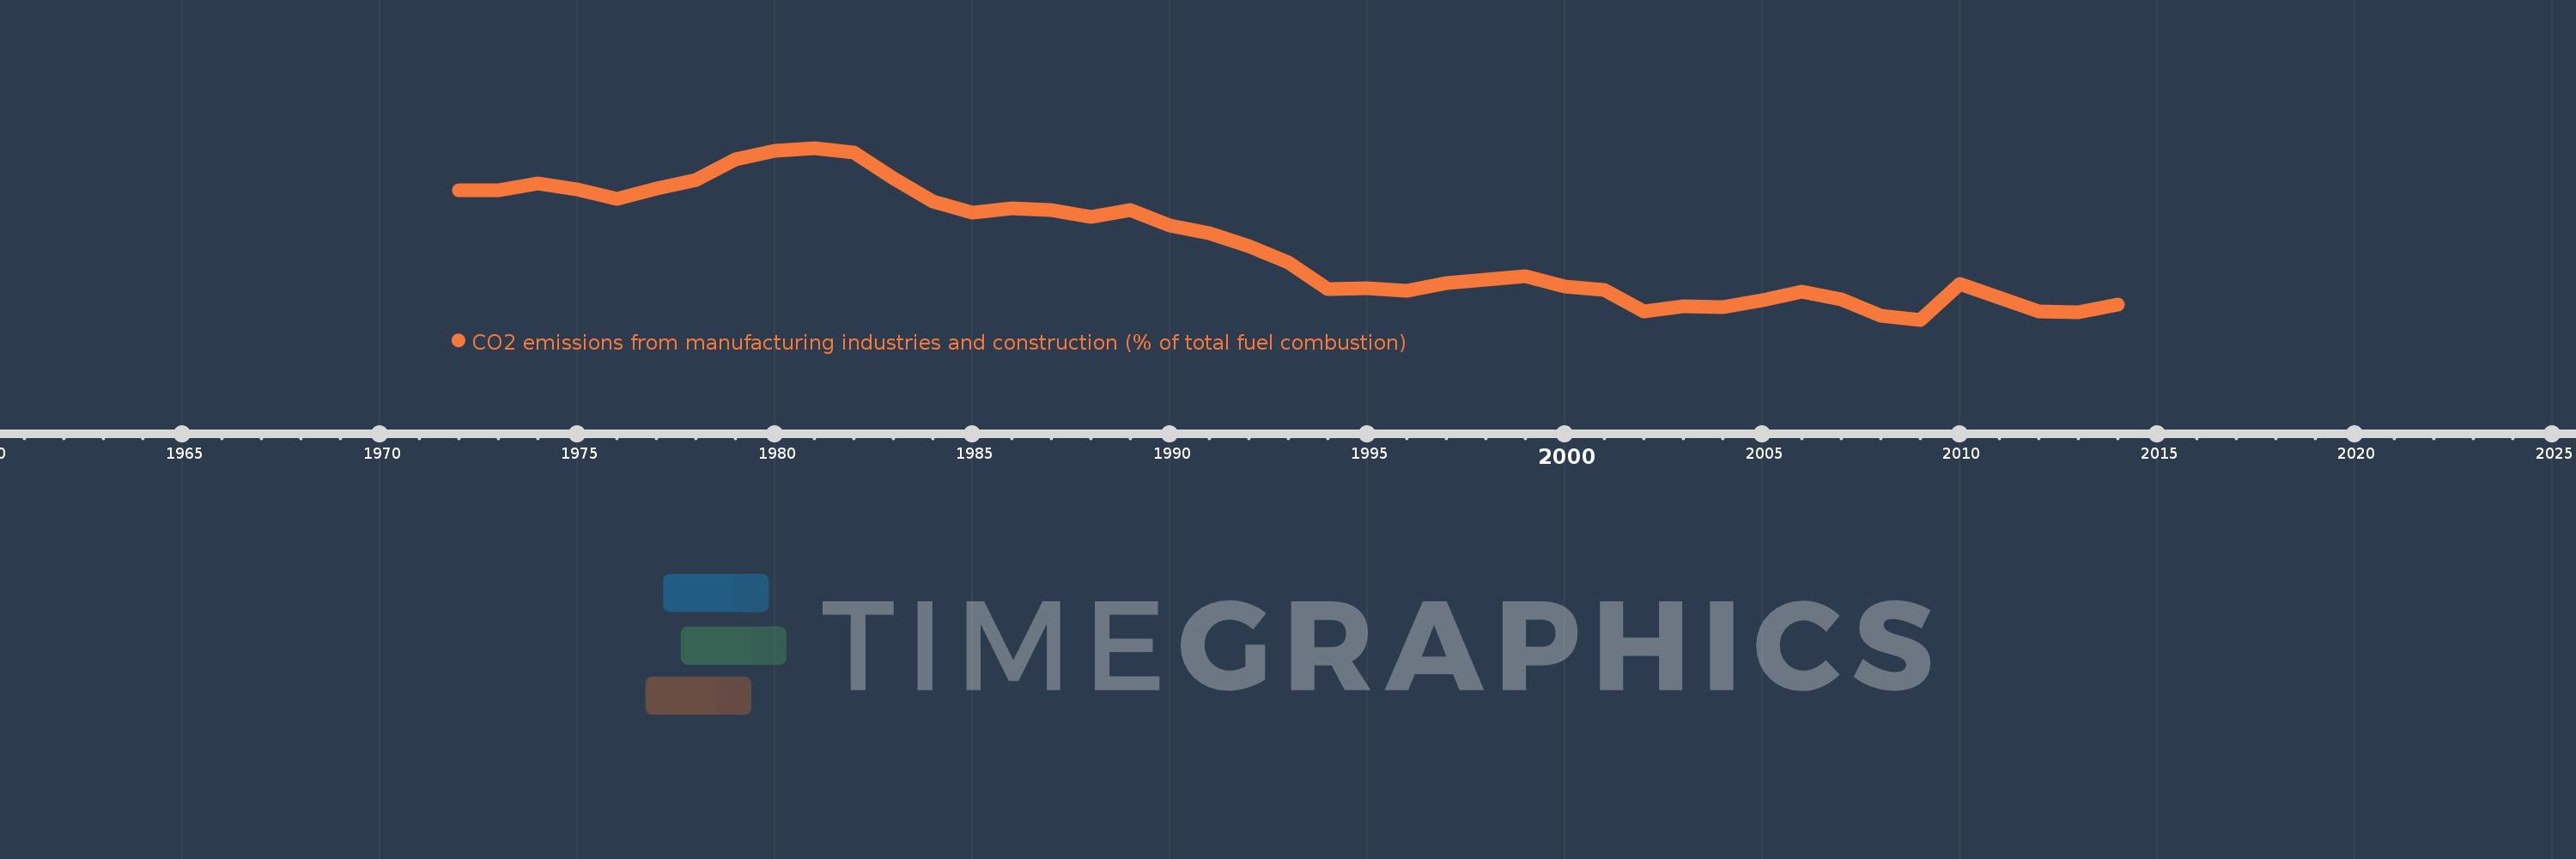
CO2 emissions from manufacturing industries and construction (% of total fuel combustion)
2014,2013,2012,2011,2010,2009,2008,2007,2006,2005,2004,2003,2002,2001,2000,1999,1998,1997,1996,1995,1994,1993,1992,1991,1990,1989,1988,1987,1986,1985,1984,1983,1982,1981,1980,1979,1978,1977,1976,1975,1974,1973,1972
Diese Statistik in anderen Ländern:
AlbaniaAlgeriaAngolaArab WorldArgentinaArmeniaAustraliaAustriaAzerbaijanBahrainBangladeshBelarusBelgiumBeninBoliviaBosnia and HerzegovinaBotswanaBrazilBrunei DarussalamBulgariaCambodiaCameroonCanadaCaribbean small statesCentral Europe and the BalticsChileChinaColombiaCongo, Dem. Rep.Congo, Rep.Costa RicaCote d'IvoireCroatiaCubaCuracaoCyprusCzech RepublicDenmarkDominican RepublicEarly-demographic dividendEast Asia & PacificEast Asia & Pacific (excluding high income)East Asia & Pacific (IDA & IBRD countries)EcuadorEgypt, Arab Rep.El SalvadorEritreaEstoniaEthiopiaEuro areaEurope & Central AsiaEurope & Central Asia (excluding high income)Europe & Central Asia (IDA & IBRD countries)European UnionFinlandFragile and conflict affected situationsFranceGabonGeorgiaGermanyGhanaGibraltarGreeceGuatemalaHaitiHeavily indebted poor countries (HIPC)High incomeHondurasHong Kong SAR, ChinaHungaryIBRD onlyIcelandIDA & IBRD totalIDA blendIDA onlyIDA totalIndiaIndonesiaIran, Islamic Rep.IraqIrelandIsraelItalyJamaicaJapanJordanKazakhstanKenyaKorea, Dem. People’s Rep.Korea, Rep.KosovoKuwaitKyrgyz RepublicLate-demographic dividendLatin America & Caribbean Latin America & Caribbean (excluding high income)Latin America & the Caribbean (IDA & IBRD countries)LatviaLeast developed countries: UN classificationLebanonLibyaLithuaniaLow & middle incomeLow incomeLower middle incomeLuxembourgMacedonia, FYRMalaysiaMaltaMauritiusMexicoMiddle East & North AfricaMiddle East & North Africa (excluding high income)Middle East & North Africa (IDA & IBRD countries)Middle incomeMoldovaMongoliaMontenegroMoroccoMozambiqueMyanmarNamibiaNepalNetherlandsNew ZealandNicaraguaNigerNigeriaNorth AmericaNorwayOECD membersOmanOther small statesPakistanPanamaParaguayPeruPhilippinesPolandPortugalPost-demographic dividendPre-demographic dividendQatarRomaniaRussian FederationSaudi ArabiaSenegalSerbiaSingaporeSlovak RepublicSloveniaSmall statesSouth AfricaSouth AsiaSouth Asia (IDA & IBRD)South SudanSpainSri LankaSub-Saharan Africa Sub-Saharan Africa (excluding high income)Sub-Saharan Africa (IDA & IBRD countries)SudanSwedenSwitzerlandSyrian Arab RepublicTajikistanTanzaniaThailandTogoTrinidad and TobagoTunisiaTurkeyTurkmenistanUkraineUnited Arab EmiratesUnited KingdomUnited StatesUpper middle incomeUruguayUzbekistanVenezuela, RBVietnamWorldYemen, Rep.ZambiaZimbabwe Zeitlinie:
Diese Zeitleiste vorliegt die Graphik ab 1972 J. bis 2014 J. South Africa. Die Angaben bis 1971 J. sind nicht vorhanden. Die Zahl aktueller Beobachtungen nach Daten: 43.
Die Quelle (Bezeichnung):
Kennzahlen der Weltentwicklung
Die Quelle (Einrichtung):
IEA Statistics © OECD/IEA 2014 (http://www.iea.org/stats/index.asp), subject to https://www.iea.org/t&c/termsandconditions/
Kategorien:
Environment
Es wurde aktualisiert:
23 Apr 2017 Jahr
Kennzahlen der Wertänderungen vom Jahr zum Jahr
Minimum:
10.366
1 Jan 2009 Jahr
Maximum:
33.775
1 Jan 1981 Jahr
Zum Datum der Beobachtung
Wert
Absolute Veränderung
Die Veränderung bezüglich dem vorherigen Wert
1 Jan 1972 Jahr
28.06
+28.06
0.0%
1 Jan 1973 Jahr
27.973
-0.087
-0.31%
1 Jan 1974 Jahr
28.985
+1.011
3.62%
1 Jan 1975 Jahr
28.127
-0.857
-2.96%
1 Jan 1976 Jahr
26.871
-1.256
-4.47%
1 Jan 1977 Jahr
28.235
+1.364
5.08%
1 Jan 1978 Jahr
29.38
+1.144
4.05%
1 Jan 1979 Jahr
32.214
+2.834
9.65%
1 Jan 1980 Jahr
33.395
+1.182
3.67%
1 Jan 1981 Jahr
33.775
+0.379
1.14%
1 Jan 1982 Jahr
33.191
-0.584
-1.73%
1 Jan 1983 Jahr
29.695
-3.496
-10.53%
1 Jan 1984 Jahr
26.445
-3.25
-10.94%
1 Jan 1985 Jahr
24.971
-1.474
-5.58%
1 Jan 1986 Jahr
25.524
+0.553
2.22%
1 Jan 1987 Jahr
25.341
-0.183
-0.72%
1 Jan 1988 Jahr
24.324
-1.017
-4.01%
1 Jan 1989 Jahr
25.266
+0.942
3.87%
1 Jan 1990 Jahr
23.215
-2.051
-8.12%
1 Jan 1991 Jahr
22.193
-1.022
-4.4%
1 Jan 1992 Jahr
20.454
-1.738
-7.83%
1 Jan 1993 Jahr
18.217
-2.237
-10.94%
1 Jan 1994 Jahr
14.579
-3.639
-19.97%
1 Jan 1995 Jahr
14.649
+0.07
0.48%
1 Jan 1996 Jahr
14.31
-0.339
-2.31%
1 Jan 1997 Jahr
15.328
+1.018
7.11%
1 Jan 1998 Jahr
15.858
+0.53
3.46%
1 Jan 1999 Jahr
16.286
+0.428
2.7%
1 Jan 2000 Jahr
14.884
-1.402
-8.61%
1 Jan 2001 Jahr
14.452
-0.431
-2.9%
1 Jan 2002 Jahr
11.54
-2.912
-20.15%
1 Jan 2003 Jahr
12.181
+0.641
5.56%
1 Jan 2004 Jahr
12.089
-0.092
-0.76%
1 Jan 2005 Jahr
13.073
+0.984
8.14%
1 Jan 2006 Jahr
14.228
+1.155
8.84%
1 Jan 2007 Jahr
13.135
-1.093
-7.68%
1 Jan 2008 Jahr
10.916
-2.219
-16.89%
1 Jan 2009 Jahr
10.366
-0.55
-5.04%
1 Jan 2010 Jahr
15.292
+4.926
47.52%
1 Jan 2011 Jahr
13.38
-1.912
-12.5%
1 Jan 2012 Jahr
11.542
-1.838
-13.74%
1 Jan 2013 Jahr
11.369
-0.173
-1.5%
1 Jan 2014 Jahr
12.476
+1.108
9.74%
Bewertung der Länder gemäß mit laufender Statistik nach Jahren


Kommentare: