29
/de/
de
AIzaSyAYiBZKx7MnpbEhh9jyipgxe19OcubqV5w
April 1, 2024
54776
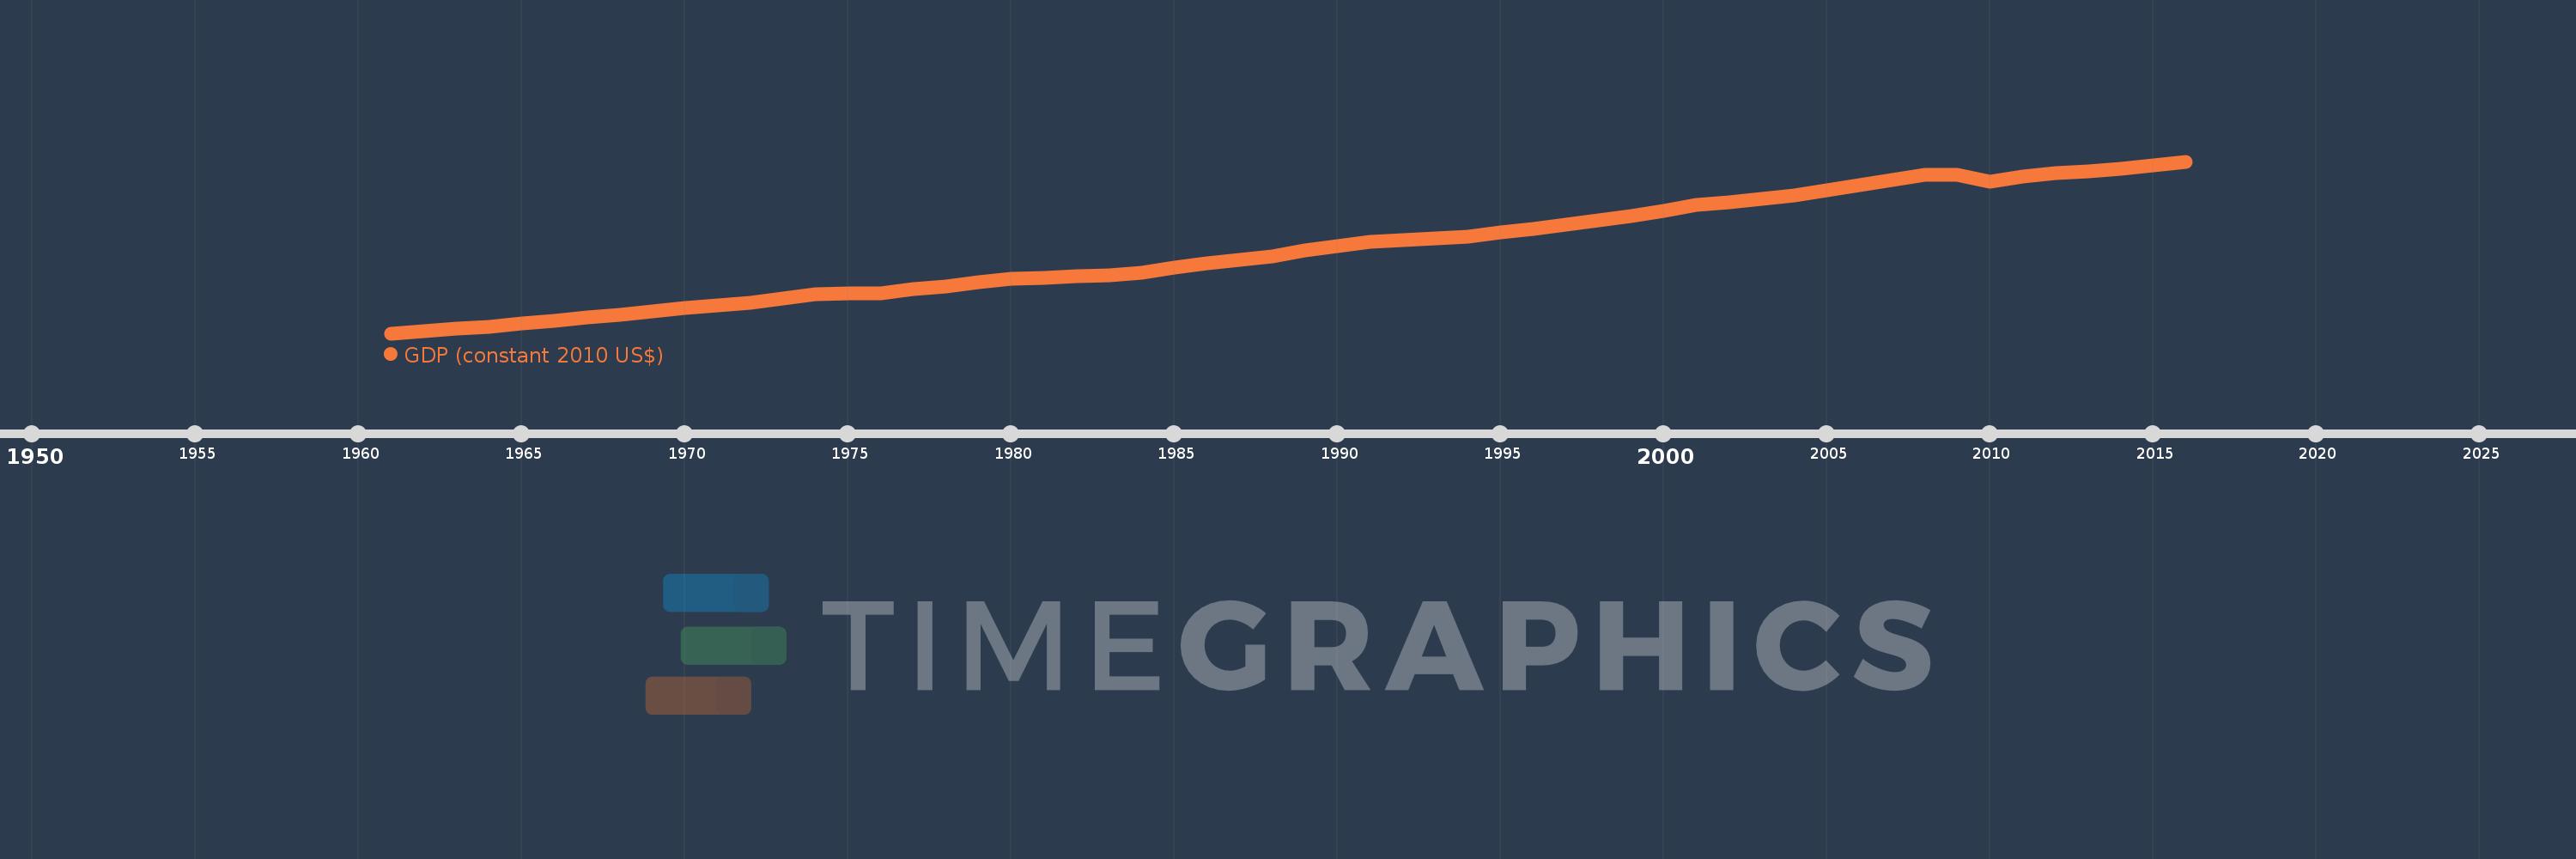
Post-demographic dividend
PST
false
2
1
GDP (constant 2010 US$)
2016,2015,2014,2013,2012,2011,2010,2009,2008,2007,2006,2005,2004,2003,2002,2001,2000,1999,1998,1997,1996,1995,1994,1993,1992,1991,1990,1989,1988,1987,1986,1985,1984,1983,1982,1981,1980,1979,1978,1977,1976,1975,1974,1973,1972,1971,1970,1969,1968,1967,1966,1965,1964,1963,1962,1961
Diese Statistik in anderen Ländern:
AfghanistanAlbaniaAlgeriaAndorraAngolaAntigua and BarbudaArab WorldArgentinaArmeniaArubaAustraliaAustriaAzerbaijanBahamas, TheBahrainBangladeshBarbadosBelarusBelgiumBelizeBeninBermudaBhutanBoliviaBosnia and HerzegovinaBotswanaBrazilBrunei DarussalamBulgariaBurkina FasoBurundiCabo VerdeCambodiaCameroonCanadaCaribbean small statesCentral African RepublicCentral Europe and the BalticsChadChileChinaColombiaComorosCongo, Dem. Rep.Congo, Rep.Costa RicaCote d'IvoireCroatiaCubaCyprusCzech RepublicDenmarkDjiboutiDominicaDominican RepublicEarly-demographic dividendEast Asia & PacificEast Asia & Pacific (excluding high income)East Asia & Pacific (IDA & IBRD countries)EcuadorEgypt, Arab Rep.El SalvadorEquatorial GuineaEritreaEstoniaEthiopiaEuro areaEurope & Central AsiaEurope & Central Asia (excluding high income)Europe & Central Asia (IDA & IBRD countries)European UnionFaroe IslandsFijiFinlandFragile and conflict affected situationsFranceGabonGambia, TheGeorgiaGermanyGhanaGreeceGreenlandGrenadaGuatemalaGuineaGuinea-BissauGuyanaHaitiHeavily indebted poor countries (HIPC)High incomeHondurasHong Kong SAR, ChinaHungaryIBRD onlyIcelandIDA & IBRD totalIDA blendIDA onlyIDA totalIndiaIndonesiaIran, Islamic Rep.IraqIrelandIsle of ManIsraelItalyJamaicaJapanJordanKazakhstanKenyaKiribatiKorea, Rep.KosovoKuwaitKyrgyz RepublicLao PDRLate-demographic dividendLatin America & Caribbean Latin America & Caribbean (excluding high income)Latin America & the Caribbean (IDA & IBRD countries)LatviaLeast developed countries: UN classificationLebanonLesothoLiberiaLibyaLiechtensteinLithuaniaLow & middle incomeLow incomeLower middle incomeLuxembourgMacao SAR, ChinaMacedonia, FYRMadagascarMalawiMalaysiaMaldivesMaliMaltaMarshall IslandsMauritaniaMauritiusMexicoMicronesia, Fed. Sts.Middle East & North AfricaMiddle East & North Africa (excluding high income)Middle East & North Africa (IDA & IBRD countries)Middle incomeMoldovaMonacoMongoliaMontenegroMoroccoMozambiqueMyanmarNamibiaNauruNepalNetherlandsNew ZealandNicaraguaNigerNigeriaNorth AmericaNorwayOECD membersOmanOther small statesPacific island small statesPakistanPalauPanamaPapua New GuineaParaguayPeruPhilippinesPolandPortugalPost-demographic dividendPre-demographic dividendPuerto RicoQatarRomaniaRussian FederationRwandaSamoaSao Tome and PrincipeSaudi ArabiaSenegalSerbiaSeychellesSierra LeoneSingaporeSlovak RepublicSloveniaSmall statesSolomon IslandsSouth AfricaSouth AsiaSouth Asia (IDA & IBRD)South SudanSpainSri LankaSt. Kitts and NevisSt. LuciaSt. Vincent and the GrenadinesSub-Saharan Africa Sub-Saharan Africa (excluding high income)Sub-Saharan Africa (IDA & IBRD countries)SudanSurinameSwazilandSwedenSwitzerlandTajikistanTanzaniaThailandTimor-LesteTogoTongaTrinidad and TobagoTunisiaTurkeyTurkmenistanTuvaluUgandaUkraineUnited Arab EmiratesUnited KingdomUnited StatesUpper middle incomeUruguayUzbekistanVanuatuVenezuela, RBVietnamWest Bank and GazaWorldYemen, Rep.ZambiaZimbabwe Zeitlinie:
Diese Zeitleiste vorliegt die Graphik ab 1961 J. bis 2016 J. Post-demographic dividend. Die Angaben bis 1960 J. sind nicht vorhanden. Die Zahl aktueller Beobachtungen nach Daten: 56.
Die Quelle (Bezeichnung):
Kennzahlen der Weltentwicklung
Die Quelle (Einrichtung):
World Bank national accounts data, and OECD National Accounts data files.
Kategorien:
Economy & Growth
Es wurde aktualisiert:
23 Apr 2017 Jahr
Kennzahlen der Wertänderungen vom Jahr zum Jahr
im Durchschnitt:
26.55 Trln
Minimum:
8.681 Trln
1 Jan 1961 Jahr
Maximum:
45.402 Trln
1 Jan 2016 Jahr
Zum Datum der Beobachtung
Wert
Absolute Veränderung
Die Veränderung bezüglich dem vorherigen Wert
1 Jan 1961 Jahr
8.681 Trln
+8.681 Trln
0.0%
1 Jan 1962 Jahr
9.09 Trln
+409.298 Mlrd.
4.72%
1 Jan 1963 Jahr
9.624 Trln
+533.68 Mlrd.
5.87%
1 Jan 1964 Jahr
10.131 Trln
+507.646 Mlrd.
5.28%
1 Jan 1965 Jahr
10.787 Trln
+655.514 Mlrd.
6.47%
1 Jan 1966 Jahr
11.385 Trln
+598.225 Mlrd.
5.55%
1 Jan 1967 Jahr
12.075 Trln
+689.775 Mlrd.
6.06%
1 Jan 1968 Jahr
12.622 Trln
+546.928 Mlrd.
4.53%
1 Jan 1969 Jahr
13.386 Trln
+764.12 Mlrd.
6.05%
1 Jan 1970 Jahr
14.157 Trln
+771.352 Mlrd.
5.76%
1 Jan 1971 Jahr
14.664 Trln
+507.392 Mlrd.
3.58%
1 Jan 1972 Jahr
15.216 Trln
+551.437 Mlrd.
3.76%
1 Jan 1973 Jahr
16.043 Trln
+827.465 Mlrd.
5.44%
1 Jan 1974 Jahr
17.039 Trln
+995.959 Mlrd.
6.21%
1 Jan 1975 Jahr
17.204 Trln
+164.877 Mlrd.
0.97%
1 Jan 1976 Jahr
17.239 Trln
+34.966 Mlrd.
0.2%
1 Jan 1977 Jahr
18.075 Trln
+835.69 Mlrd.
4.85%
1 Jan 1978 Jahr
18.755 Trln
+680.272 Mlrd.
3.76%
1 Jan 1979 Jahr
19.566 Trln
+811.297 Mlrd.
4.33%
1 Jan 1980 Jahr
20.33 Trln
+763.927 Mlrd.
3.9%
1 Jan 1981 Jahr
20.569 Trln
+238.434 Mlrd.
1.17%
1 Jan 1982 Jahr
20.972 Trln
+403.353 Mlrd.
1.96%
1 Jan 1983 Jahr
21.038 Trln
+65.662 Mlrd.
0.31%
1 Jan 1984 Jahr
21.665 Trln
+627.164 Mlrd.
2.98%
1 Jan 1985 Jahr
22.673 Trln
+1.008 Trln
4.65%
1 Jan 1986 Jahr
23.563 Trln
+890.162 Mlrd.
3.93%
1 Jan 1987 Jahr
24.297 Trln
+733.213 Mlrd.
3.11%
1 Jan 1988 Jahr
25.13 Trln
+833.126 Mlrd.
3.43%
1 Jan 1989 Jahr
26.337 Trln
+1.207 Trln
4.8%
1 Jan 1990 Jahr
27.371 Trln
+1.034 Trln
3.93%
1 Jan 1991 Jahr
28.175 Trln
+803.962 Mlrd.
2.94%
1 Jan 1992 Jahr
28.52 Trln
+345.797 Mlrd.
1.23%
1 Jan 1993 Jahr
29.04 Trln
+519.82 Mlrd.
1.82%
1 Jan 1994 Jahr
29.352 Trln
+312.164 Mlrd.
1.07%
1 Jan 1995 Jahr
30.22 Trln
+867.194 Mlrd.
2.95%
1 Jan 1996 Jahr
30.996 Trln
+776.525 Mlrd.
2.57%
1 Jan 1997 Jahr
31.853 Trln
+856.446 Mlrd.
2.76%
1 Jan 1998 Jahr
32.903 Trln
+1.05 Trln
3.3%
1 Jan 1999 Jahr
33.726 Trln
+823.902 Mlrd.
2.5%
1 Jan 2000 Jahr
34.852 Trln
+1.125 Trln
3.34%
1 Jan 2001 Jahr
36.2 Trln
+1.349 Trln
3.87%
1 Jan 2002 Jahr
36.751 Trln
+550.956 Mlrd.
1.52%
1 Jan 2003 Jahr
37.327 Trln
+576.07 Mlrd.
1.57%
1 Jan 2004 Jahr
38.064 Trln
+736.997 Mlrd.
1.97%
1 Jan 2005 Jahr
39.258 Trln
+1.194 Trln
3.14%
1 Jan 2006 Jahr
40.268 Trln
+1.01 Trln
2.57%
1 Jan 2007 Jahr
41.43 Trln
+1.163 Trln
2.89%
1 Jan 2008 Jahr
42.483 Trln
+1.053 Trln
2.54%
1 Jan 2009 Jahr
42.551 Trln
+67.277 Mlrd.
0.16%
1 Jan 2010 Jahr
41.018 Trln
-1.533 Trln
-3.6%
1 Jan 2011 Jahr
42.19 Trln
+1.172 Trln
2.86%
1 Jan 2012 Jahr
42.836 Trln
+646.262 Mlrd.
1.53%
1 Jan 2013 Jahr
43.321 Trln
+484.69 Mlrd.
1.13%
1 Jan 2014 Jahr
43.822 Trln
+501.432 Mlrd.
1.16%
1 Jan 2015 Jahr
44.574 Trln
+752.14 Mlrd.
1.72%
1 Jan 2016 Jahr
45.402 Trln
+827.566 Mlrd.
1.86%
Bewertung der Länder gemäß mit laufender Statistik nach Jahren


Kommentare: