29
/de/
de
AIzaSyAYiBZKx7MnpbEhh9jyipgxe19OcubqV5w
April 1, 2024
43423
Latin America & the Caribbean (IDA & IBRD countries)
TLA
false
2
1
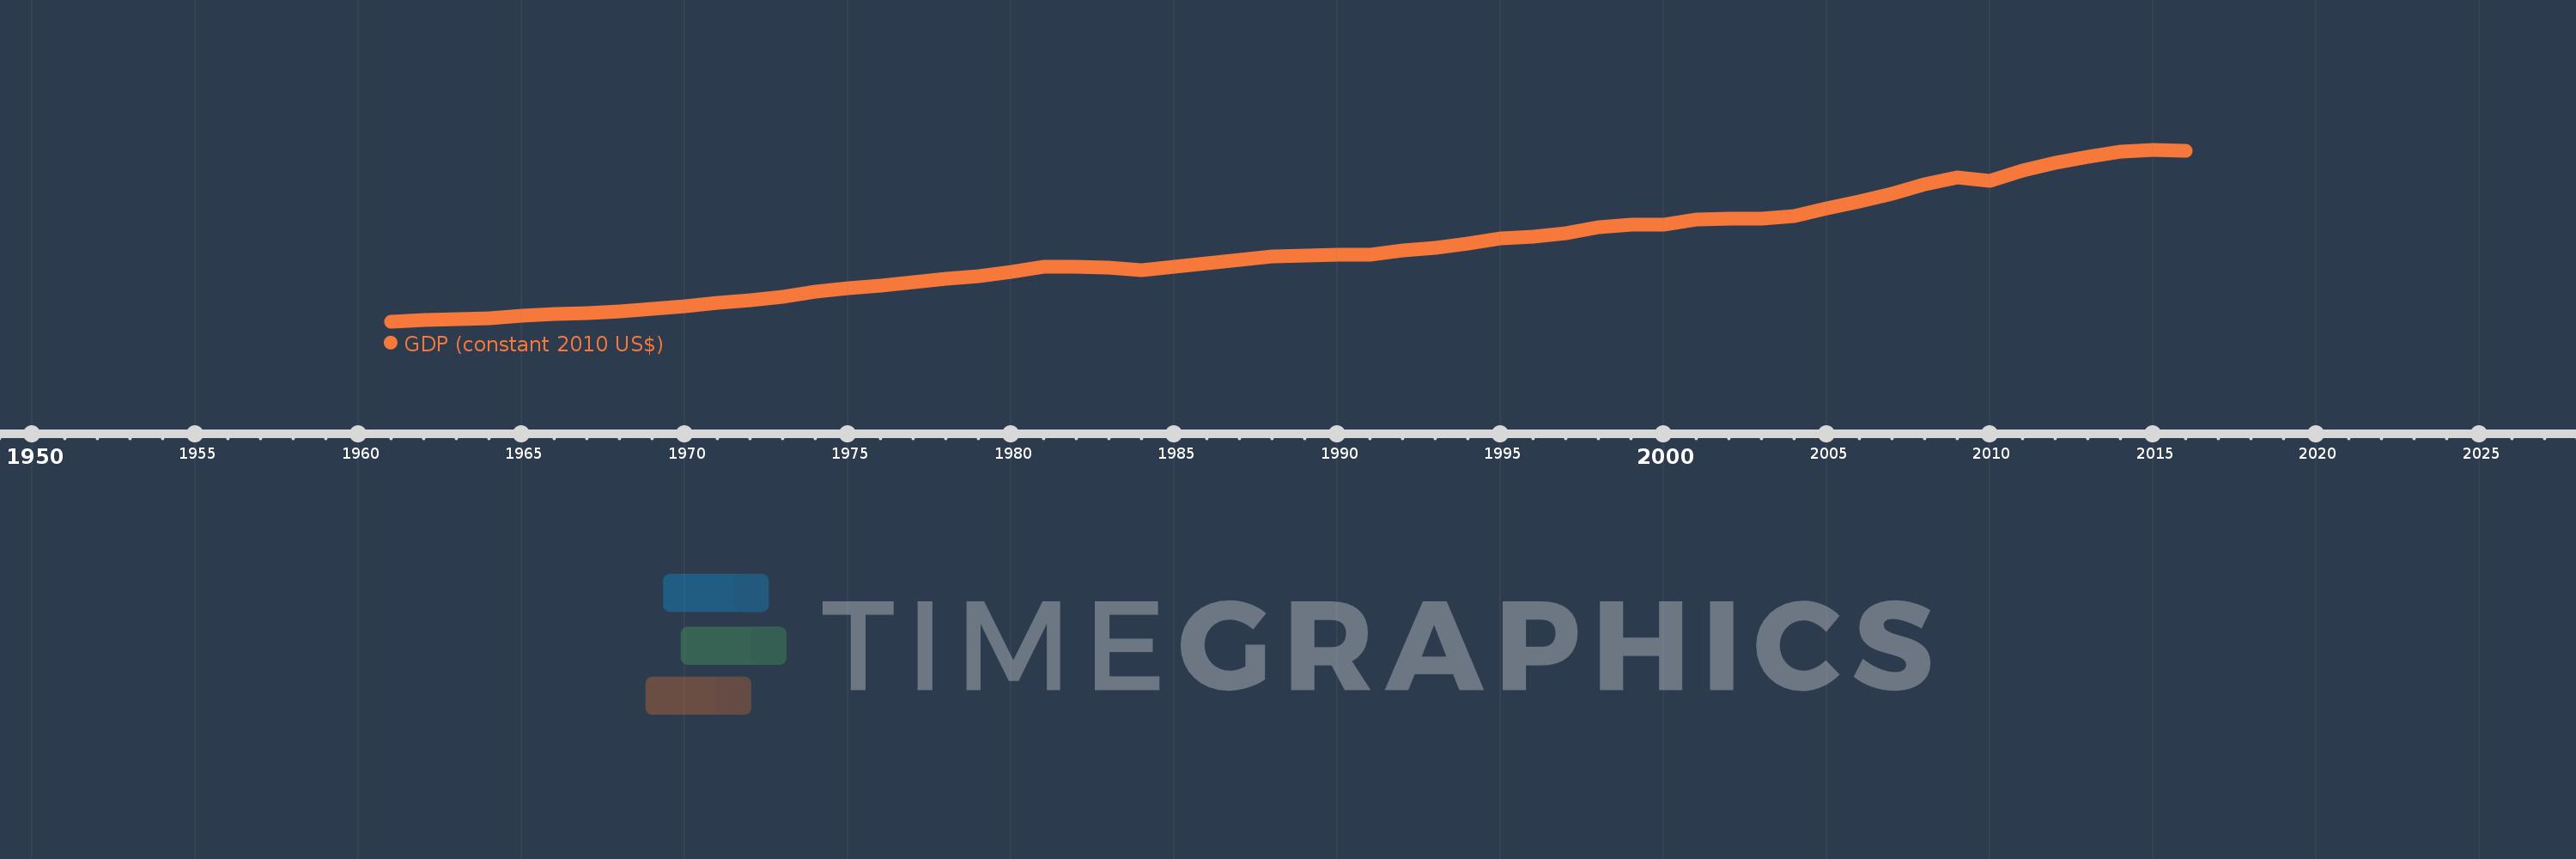
GDP (constant 2010 US$)
2016,2015,2014,2013,2012,2011,2010,2009,2008,2007,2006,2005,2004,2003,2002,2001,2000,1999,1998,1997,1996,1995,1994,1993,1992,1991,1990,1989,1988,1987,1986,1985,1984,1983,1982,1981,1980,1979,1978,1977,1976,1975,1974,1973,1972,1971,1970,1969,1968,1967,1966,1965,1964,1963,1962,1961
Diese Statistik in anderen Ländern:
AfghanistanAlbaniaAlgeriaAndorraAngolaAntigua and BarbudaArab WorldArgentinaArmeniaArubaAustraliaAustriaAzerbaijanBahamas, TheBahrainBangladeshBarbadosBelarusBelgiumBelizeBeninBermudaBhutanBoliviaBosnia and HerzegovinaBotswanaBrazilBrunei DarussalamBulgariaBurkina FasoBurundiCabo VerdeCambodiaCameroonCanadaCaribbean small statesCentral African RepublicCentral Europe and the BalticsChadChileChinaColombiaComorosCongo, Dem. Rep.Congo, Rep.Costa RicaCote d'IvoireCroatiaCubaCyprusCzech RepublicDenmarkDjiboutiDominicaDominican RepublicEarly-demographic dividendEast Asia & PacificEast Asia & Pacific (excluding high income)East Asia & Pacific (IDA & IBRD countries)EcuadorEgypt, Arab Rep.El SalvadorEquatorial GuineaEritreaEstoniaEthiopiaEuro areaEurope & Central AsiaEurope & Central Asia (excluding high income)Europe & Central Asia (IDA & IBRD countries)European UnionFaroe IslandsFijiFinlandFragile and conflict affected situationsFranceGabonGambia, TheGeorgiaGermanyGhanaGreeceGreenlandGrenadaGuatemalaGuineaGuinea-BissauGuyanaHaitiHeavily indebted poor countries (HIPC)High incomeHondurasHong Kong SAR, ChinaHungaryIBRD onlyIcelandIDA & IBRD totalIDA blendIDA onlyIDA totalIndiaIndonesiaIran, Islamic Rep.IraqIrelandIsle of ManIsraelItalyJamaicaJapanJordanKazakhstanKenyaKiribatiKorea, Rep.KosovoKuwaitKyrgyz RepublicLao PDRLate-demographic dividendLatin America & Caribbean Latin America & Caribbean (excluding high income)Latin America & the Caribbean (IDA & IBRD countries)LatviaLeast developed countries: UN classificationLebanonLesothoLiberiaLibyaLiechtensteinLithuaniaLow & middle incomeLow incomeLower middle incomeLuxembourgMacao SAR, ChinaMacedonia, FYRMadagascarMalawiMalaysiaMaldivesMaliMaltaMarshall IslandsMauritaniaMauritiusMexicoMicronesia, Fed. Sts.Middle East & North AfricaMiddle East & North Africa (excluding high income)Middle East & North Africa (IDA & IBRD countries)Middle incomeMoldovaMonacoMongoliaMontenegroMoroccoMozambiqueMyanmarNamibiaNauruNepalNetherlandsNew ZealandNicaraguaNigerNigeriaNorth AmericaNorwayOECD membersOmanOther small statesPacific island small statesPakistanPalauPanamaPapua New GuineaParaguayPeruPhilippinesPolandPortugalPost-demographic dividendPre-demographic dividendPuerto RicoQatarRomaniaRussian FederationRwandaSamoaSao Tome and PrincipeSaudi ArabiaSenegalSerbiaSeychellesSierra LeoneSingaporeSlovak RepublicSloveniaSmall statesSolomon IslandsSouth AfricaSouth AsiaSouth Asia (IDA & IBRD)South SudanSpainSri LankaSt. Kitts and NevisSt. LuciaSt. Vincent and the GrenadinesSub-Saharan Africa Sub-Saharan Africa (excluding high income)Sub-Saharan Africa (IDA & IBRD countries)SudanSurinameSwazilandSwedenSwitzerlandTajikistanTanzaniaThailandTimor-LesteTogoTongaTrinidad and TobagoTunisiaTurkeyTurkmenistanTuvaluUgandaUkraineUnited Arab EmiratesUnited KingdomUnited StatesUpper middle incomeUruguayUzbekistanVanuatuVenezuela, RBVietnamWest Bank and GazaWorldYemen, Rep.ZambiaZimbabwe Zeitlinie:
Diese Zeitleiste vorliegt die Graphik ab 1961 J. bis 2016 J. Latin America & the Caribbean (IDA & IBRD countries). Die Angaben bis 1960 J. sind nicht vorhanden. Die Zahl aktueller Beobachtungen nach Daten: 56.
Die Quelle (Bezeichnung):
Kennzahlen der Weltentwicklung
Die Quelle (Einrichtung):
World Bank national accounts data, and OECD National Accounts data files.
Kategorien:
Economy & Growth
Es wurde aktualisiert:
23 Apr 2017 Jahr
Kennzahlen der Wertänderungen vom Jahr zum Jahr
im Durchschnitt:
2.852 Trln
Minimum:
768.039 Mlrd.
1 Jan 1961 Jahr
Maximum:
5.734 Trln
1 Jan 2015 Jahr
Zum Datum der Beobachtung
Wert
Absolute Veränderung
Die Veränderung bezüglich dem vorherigen Wert
1 Jan 1961 Jahr
768.039 Mlrd.
+768.039 Mlrd.
0.0%
1 Jan 1962 Jahr
817.926 Mlrd.
+49.887 Mlrd.
6.5%
1 Jan 1963 Jahr
856.805 Mlrd.
+38.879 Mlrd.
4.75%
1 Jan 1964 Jahr
877.485 Mlrd.
+20.68 Mlrd.
2.41%
1 Jan 1965 Jahr
942.839 Mlrd.
+65.354 Mlrd.
7.45%
1 Jan 1966 Jahr
990.73 Mlrd.
+47.891 Mlrd.
5.08%
1 Jan 1967 Jahr
1.03 Trln
+39.137 Mlrd.
3.95%
1 Jan 1968 Jahr
1.075 Trln
+44.762 Mlrd.
4.35%
1 Jan 1969 Jahr
1.159 Trln
+84.726 Mlrd.
7.88%
1 Jan 1970 Jahr
1.231 Trln
+72.052 Mlrd.
6.21%
1 Jan 1971 Jahr
1.313 Trln
+81.869 Mlrd.
6.65%
1 Jan 1972 Jahr
1.401 Trln
+87.379 Mlrd.
6.65%
1 Jan 1973 Jahr
1.502 Trln
+101.675 Mlrd.
7.26%
1 Jan 1974 Jahr
1.634 Trln
+131.928 Mlrd.
8.78%
1 Jan 1975 Jahr
1.742 Trln
+107.811 Mlrd.
6.6%
1 Jan 1976 Jahr
1.809 Trln
+66.836 Mlrd.
3.84%
1 Jan 1977 Jahr
1.921 Trln
+111.608 Mlrd.
6.17%
1 Jan 1978 Jahr
2.011 Trln
+90.811 Mlrd.
4.73%
1 Jan 1979 Jahr
2.086 Trln
+75.171 Mlrd.
3.74%
1 Jan 1980 Jahr
2.224 Trln
+137.355 Mlrd.
6.58%
1 Jan 1981 Jahr
2.367 Trln
+142.961 Mlrd.
6.43%
1 Jan 1982 Jahr
2.367 Trln
-27.141 Mln.
0.0%
1 Jan 1983 Jahr
2.345 Trln
-21.841 Mlrd.
-0.92%
1 Jan 1984 Jahr
2.277 Trln
-67.461 Mlrd.
-2.88%
1 Jan 1985 Jahr
2.365 Trln
+87.992 Mlrd.
3.86%
1 Jan 1986 Jahr
2.452 Trln
+86.919 Mlrd.
3.67%
1 Jan 1987 Jahr
2.566 Trln
+113.641 Mlrd.
4.63%
1 Jan 1988 Jahr
2.655 Trln
+89.373 Mlrd.
3.48%
1 Jan 1989 Jahr
2.675 Trln
+19.705 Mlrd.
0.74%
1 Jan 1990 Jahr
2.71 Trln
+34.606 Mlrd.
1.29%
1 Jan 1991 Jahr
2.724 Trln
+13.968 Mlrd.
0.52%
1 Jan 1992 Jahr
2.834 Trln
+110.095 Mlrd.
4.04%
1 Jan 1993 Jahr
2.921 Trln
+87.686 Mlrd.
3.09%
1 Jan 1994 Jahr
3.043 Trln
+121.457 Mlrd.
4.16%
1 Jan 1995 Jahr
3.184 Trln
+141.044 Mlrd.
4.64%
1 Jan 1996 Jahr
3.237 Trln
+53.003 Mlrd.
1.66%
1 Jan 1997 Jahr
3.345 Trln
+108.175 Mlrd.
3.34%
1 Jan 1998 Jahr
3.518 Trln
+172.402 Mlrd.
5.15%
1 Jan 1999 Jahr
3.588 Trln
+70.691 Mlrd.
2.01%
1 Jan 2000 Jahr
3.584 Trln
-4.076 Mlrd.
-0.11%
1 Jan 2001 Jahr
3.72 Trln
+136.127 Mlrd.
3.8%
1 Jan 2002 Jahr
3.75 Trln
+29.924 Mlrd.
0.8%
1 Jan 2003 Jahr
3.761 Trln
+10.433 Mlrd.
0.28%
1 Jan 2004 Jahr
3.82 Trln
+59.624 Mlrd.
1.59%
1 Jan 2005 Jahr
4.063 Trln
+243.09 Mlrd.
6.36%
1 Jan 2006 Jahr
4.247 Trln
+183.854 Mlrd.
4.52%
1 Jan 2007 Jahr
4.477 Trln
+229.478 Mlrd.
5.4%
1 Jan 2008 Jahr
4.742 Trln
+265.306 Mlrd.
5.93%
1 Jan 2009 Jahr
4.938 Trln
+195.534 Mlrd.
4.12%
1 Jan 2010 Jahr
4.851 Trln
-86.241 Mlrd.
-1.75%
1 Jan 2011 Jahr
5.144 Trln
+292.388 Mlrd.
6.03%
1 Jan 2012 Jahr
5.377 Trln
+232.859 Mlrd.
4.53%
1 Jan 2013 Jahr
5.534 Trln
+157.342 Mlrd.
2.93%
1 Jan 2014 Jahr
5.691 Trln
+157.547 Mlrd.
2.85%
1 Jan 2015 Jahr
5.734 Trln
+42.219 Mlrd.
0.74%
1 Jan 2016 Jahr
5.717 Trln
-16.821 Mlrd.
-0.29%
Bewertung der Länder gemäß mit laufender Statistik nach Jahren


Kommentare: