29
/de/
de
AIzaSyAYiBZKx7MnpbEhh9jyipgxe19OcubqV5w
April 1, 2024
54214
Pacific island small states
PSS
false
2
1
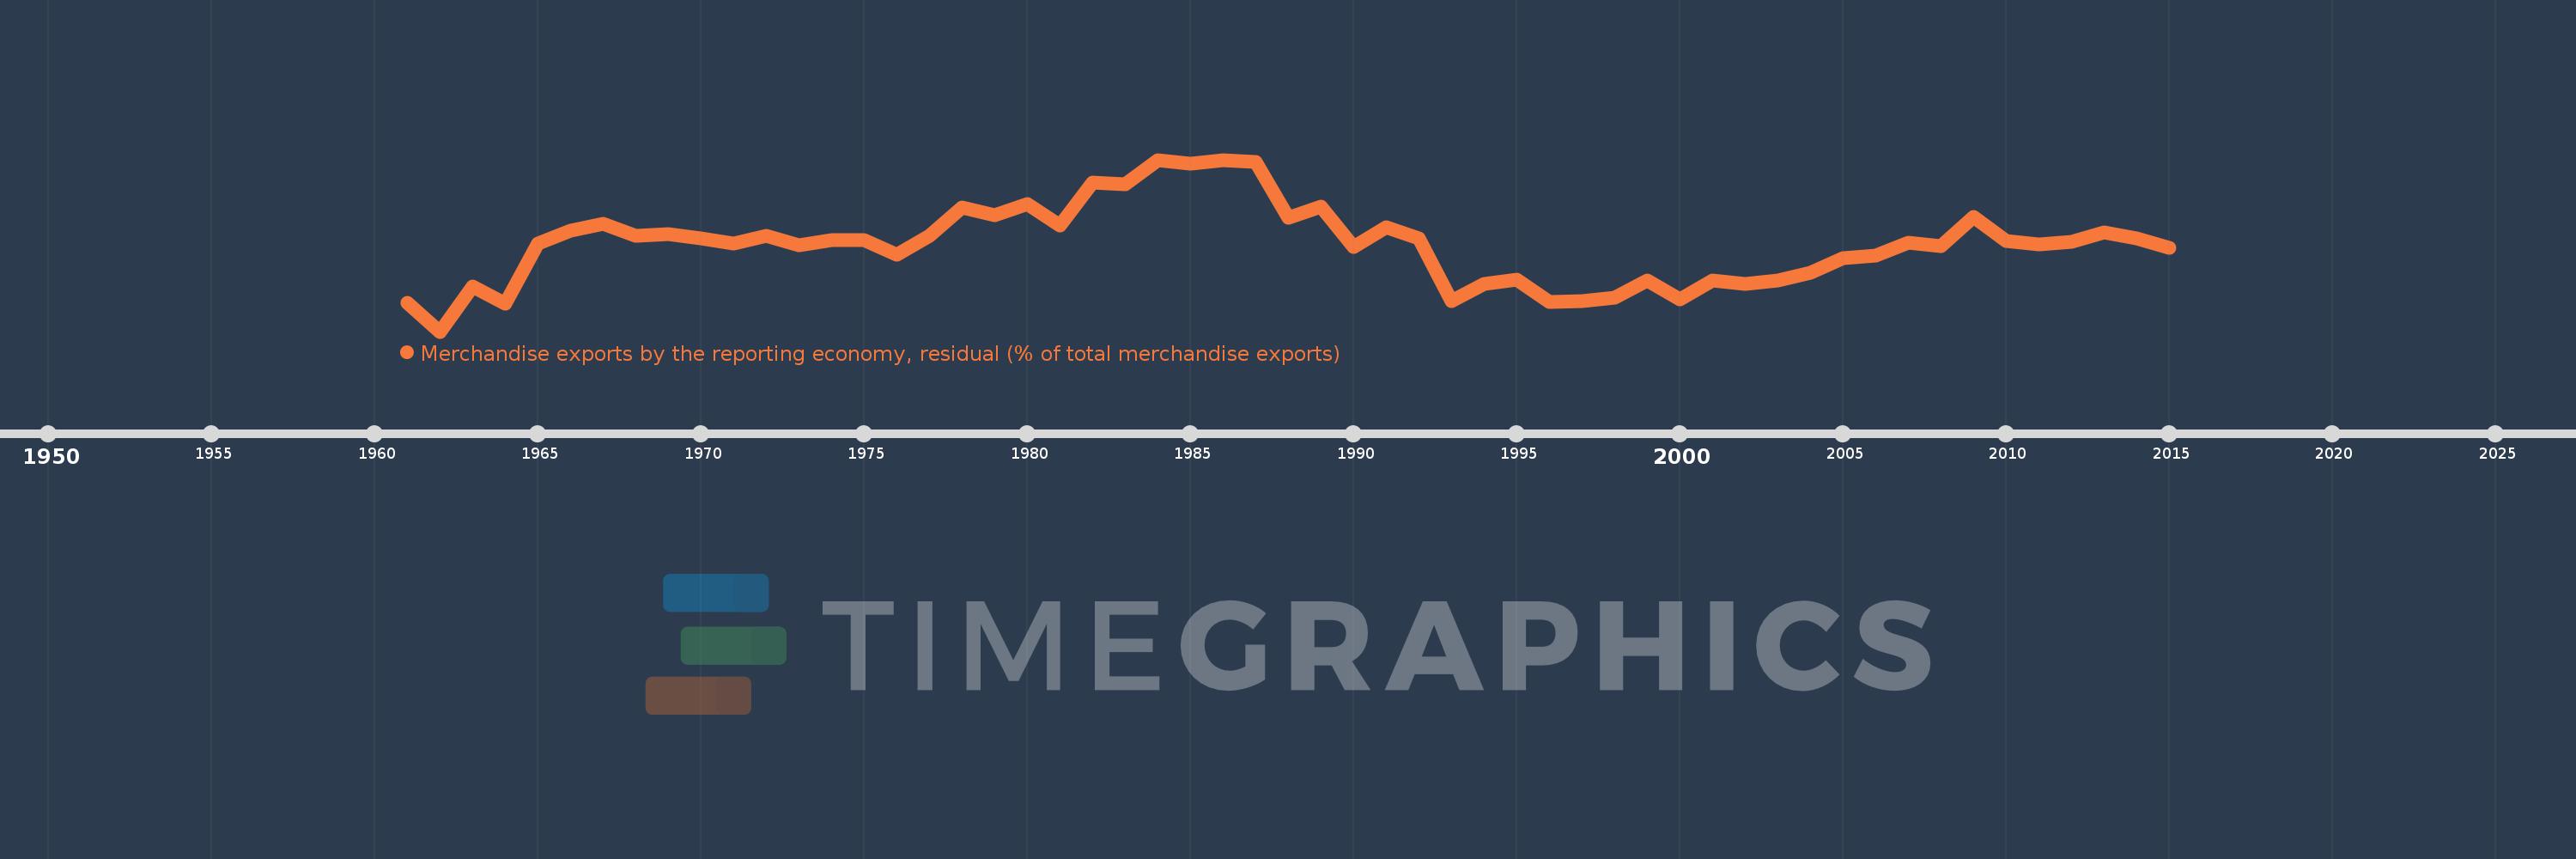
Merchandise exports by the reporting economy, residual (% of total merchandise exports)
2015,2014,2013,2012,2011,2010,2009,2008,2007,2006,2005,2004,2003,2002,2001,2000,1999,1998,1997,1996,1995,1994,1993,1992,1991,1990,1989,1988,1987,1986,1985,1984,1983,1982,1981,1980,1979,1978,1977,1976,1975,1974,1973,1972,1971,1970,1969,1968,1967,1966,1965,1964,1963,1962,1961
Diese Statistik in anderen Ländern:
AfghanistanAlbaniaAlgeriaAmerican SamoaAngolaAntigua and BarbudaArab WorldArgentinaArmeniaArubaAustraliaAustriaAzerbaijanBahamas, TheBahrainBangladeshBarbadosBelarusBelgiumBelizeBeninBermudaBoliviaBosnia and HerzegovinaBrazilBrunei DarussalamBulgariaBurkina FasoBurundiCabo VerdeCambodiaCameroonCanadaCaribbean small statesCentral African RepublicCentral Europe and the BalticsChadChileChinaColombiaComorosCongo, Dem. Rep.Congo, Rep.Costa RicaCote d'IvoireCroatiaCubaCyprusCzech RepublicDenmarkDjiboutiDominicaDominican RepublicEarly-demographic dividendEast Asia & PacificEast Asia & Pacific (excluding high income)East Asia & Pacific (IDA & IBRD countries)EcuadorEgypt, Arab Rep.El SalvadorEquatorial GuineaEstoniaEthiopiaEuro areaEurope & Central AsiaEurope & Central Asia (excluding high income)Europe & Central Asia (IDA & IBRD countries)European UnionFaroe IslandsFijiFinlandFragile and conflict affected situationsFranceFrench PolynesiaGabonGambia, TheGeorgiaGermanyGhanaGibraltarGreeceGreenlandGrenadaGuamGuatemalaGuineaGuinea-BissauGuyanaHaitiHeavily indebted poor countries (HIPC)High incomeHondurasHong Kong SAR, ChinaHungaryIBRD onlyIcelandIDA & IBRD totalIDA blendIDA onlyIDA totalIndiaIndonesiaIran, Islamic Rep.IraqIrelandIsraelItalyJamaicaJapanJordanKazakhstanKenyaKiribatiKorea, Dem. People’s Rep.Korea, Rep.KosovoKuwaitKyrgyz RepublicLao PDRLate-demographic dividendLatin America & Caribbean Latin America & Caribbean (excluding high income)Latin America & the Caribbean (IDA & IBRD countries)LatviaLeast developed countries: UN classificationLebanonLiberiaLibyaLithuaniaLow & middle incomeLow incomeLower middle incomeLuxembourgMacao SAR, ChinaMacedonia, FYRMadagascarMalawiMalaysiaMaldivesMaliMaltaMauritaniaMauritiusMexicoMiddle East & North AfricaMiddle East & North Africa (excluding high income)Middle East & North Africa (IDA & IBRD countries)Middle incomeMoldovaMongoliaMontenegroMoroccoMozambiqueMyanmarNauruNepalNetherlandsNew CaledoniaNew ZealandNicaraguaNigerNigeriaNorth AmericaNorwayOECD membersOmanOther small statesPacific island small statesPakistanPanamaPapua New GuineaParaguayPeruPhilippinesPolandPortugalPost-demographic dividendPre-demographic dividendQatarRomaniaRussian FederationRwandaSamoaSao Tome and PrincipeSaudi ArabiaSenegalSerbiaSeychellesSierra LeoneSingaporeSlovak RepublicSloveniaSmall statesSolomon IslandsSomaliaSouth AfricaSouth AsiaSouth Asia (IDA & IBRD)SpainSri LankaSt. Kitts and NevisSt. LuciaSt. Vincent and the GrenadinesSub-Saharan Africa Sub-Saharan Africa (excluding high income)Sub-Saharan Africa (IDA & IBRD countries)SudanSurinameSwedenSwitzerlandSyrian Arab RepublicTajikistanTanzaniaThailandTogoTongaTrinidad and TobagoTunisiaTurkeyTurkmenistanTuvaluUgandaUkraineUnited Arab EmiratesUnited KingdomUnited StatesUpper middle incomeUruguayUzbekistanVanuatuVenezuela, RBVietnamWorldYemen, Rep.ZambiaZimbabwe Zeitlinie:
Diese Zeitleiste vorliegt die Graphik ab 1961 J. bis 2015 J. Pacific island small states. Die Angaben bis 1960 J. sind nicht vorhanden. Die Zahl aktueller Beobachtungen nach Daten: 55.
Die Quelle (Bezeichnung):
Kennzahlen der Weltentwicklung
Die Quelle (Einrichtung):
World Bank staff estimates based data from International Monetary Fund's Direction of Trade database.
Kategorien:
Private Sector, Trade
Es wurde aktualisiert:
23 Apr 2017 Jahr
Kennzahlen der Wertänderungen vom Jahr zum Jahr
Minimum:
0.0
1 Jan 1962 Jahr
Maximum:
55.863
1 Jan 1986 Jahr
Zum Datum der Beobachtung
Wert
Absolute Veränderung
Die Veränderung bezüglich dem vorherigen Wert
1 Jan 1961 Jahr
9.367
+9.367
0.0%
1 Jan 1962 Jahr
0.0
-9.367
-100.0%
1 Jan 1963 Jahr
14.61
+14.61
%
1 Jan 1964 Jahr
9.009
-5.601
-38.33%
1 Jan 1965 Jahr
28.609
+19.6
217.56%
1 Jan 1966 Jahr
32.87
+4.262
14.9%
1 Jan 1967 Jahr
34.936
+2.065
6.28%
1 Jan 1968 Jahr
31.243
-3.693
-10.57%
1 Jan 1969 Jahr
31.659
+0.416
1.33%
1 Jan 1970 Jahr
30.28
-1.378
-4.35%
1 Jan 1971 Jahr
28.595
-1.686
-5.57%
1 Jan 1972 Jahr
31.236
+2.642
9.24%
1 Jan 1973 Jahr
28.01
-3.226
-10.33%
1 Jan 1974 Jahr
29.724
+1.713
6.12%
1 Jan 1975 Jahr
29.7
-0.023
-0.08%
1 Jan 1976 Jahr
25.006
-4.694
-15.8%
1 Jan 1977 Jahr
31.021
+6.015
24.06%
1 Jan 1978 Jahr
40.323
+9.301
29.98%
1 Jan 1979 Jahr
37.892
-2.43
-6.03%
1 Jan 1980 Jahr
41.388
+3.496
9.23%
1 Jan 1981 Jahr
34.507
-6.882
-16.63%
1 Jan 1982 Jahr
48.487
+13.98
40.51%
1 Jan 1983 Jahr
47.845
-0.642
-1.32%
1 Jan 1984 Jahr
55.706
+7.86
16.43%
1 Jan 1985 Jahr
54.609
-1.097
-1.97%
1 Jan 1986 Jahr
55.863
+1.254
2.3%
1 Jan 1987 Jahr
55.21
-0.653
-1.17%
1 Jan 1988 Jahr
36.929
-18.281
-33.11%
1 Jan 1989 Jahr
40.674
+3.745
10.14%
1 Jan 1990 Jahr
27.409
-13.265
-32.61%
1 Jan 1991 Jahr
33.83
+6.421
23.42%
1 Jan 1992 Jahr
30.21
-3.62
-10.7%
1 Jan 1993 Jahr
10.009
-20.201
-66.87%
1 Jan 1994 Jahr
15.511
+5.502
54.98%
1 Jan 1995 Jahr
16.951
+1.439
9.28%
1 Jan 1996 Jahr
9.59
-7.361
-43.42%
1 Jan 1997 Jahr
9.907
+0.317
3.31%
1 Jan 1998 Jahr
11.094
+1.187
11.98%
1 Jan 1999 Jahr
16.71
+5.616
50.62%
1 Jan 2000 Jahr
10.601
-6.109
-36.56%
1 Jan 2001 Jahr
16.614
+6.013
56.73%
1 Jan 2002 Jahr
15.491
-1.123
-6.76%
1 Jan 2003 Jahr
16.686
+1.195
7.71%
1 Jan 2004 Jahr
19.153
+2.467
14.79%
1 Jan 2005 Jahr
23.768
+4.614
24.09%
1 Jan 2006 Jahr
24.858
+1.09
4.59%
1 Jan 2007 Jahr
28.978
+4.12
16.57%
1 Jan 2008 Jahr
27.89
-1.088
-3.76%
1 Jan 2009 Jahr
37.381
+9.491
34.03%
1 Jan 2010 Jahr
29.55
-7.831
-20.95%
1 Jan 2011 Jahr
28.4
-1.15
-3.89%
1 Jan 2012 Jahr
29.117
+0.717
2.53%
1 Jan 2013 Jahr
32.138
+3.021
10.37%
1 Jan 2014 Jahr
30.169
-1.969
-6.13%
1 Jan 2015 Jahr
27.37
-2.799
-9.28%
Bewertung der Länder gemäß mit laufender Statistik nach Jahren


Kommentare: