29
/de/
de
AIzaSyAYiBZKx7MnpbEhh9jyipgxe19OcubqV5w
April 1, 2024
239551
Sierra Leone
SLE
true
2
1
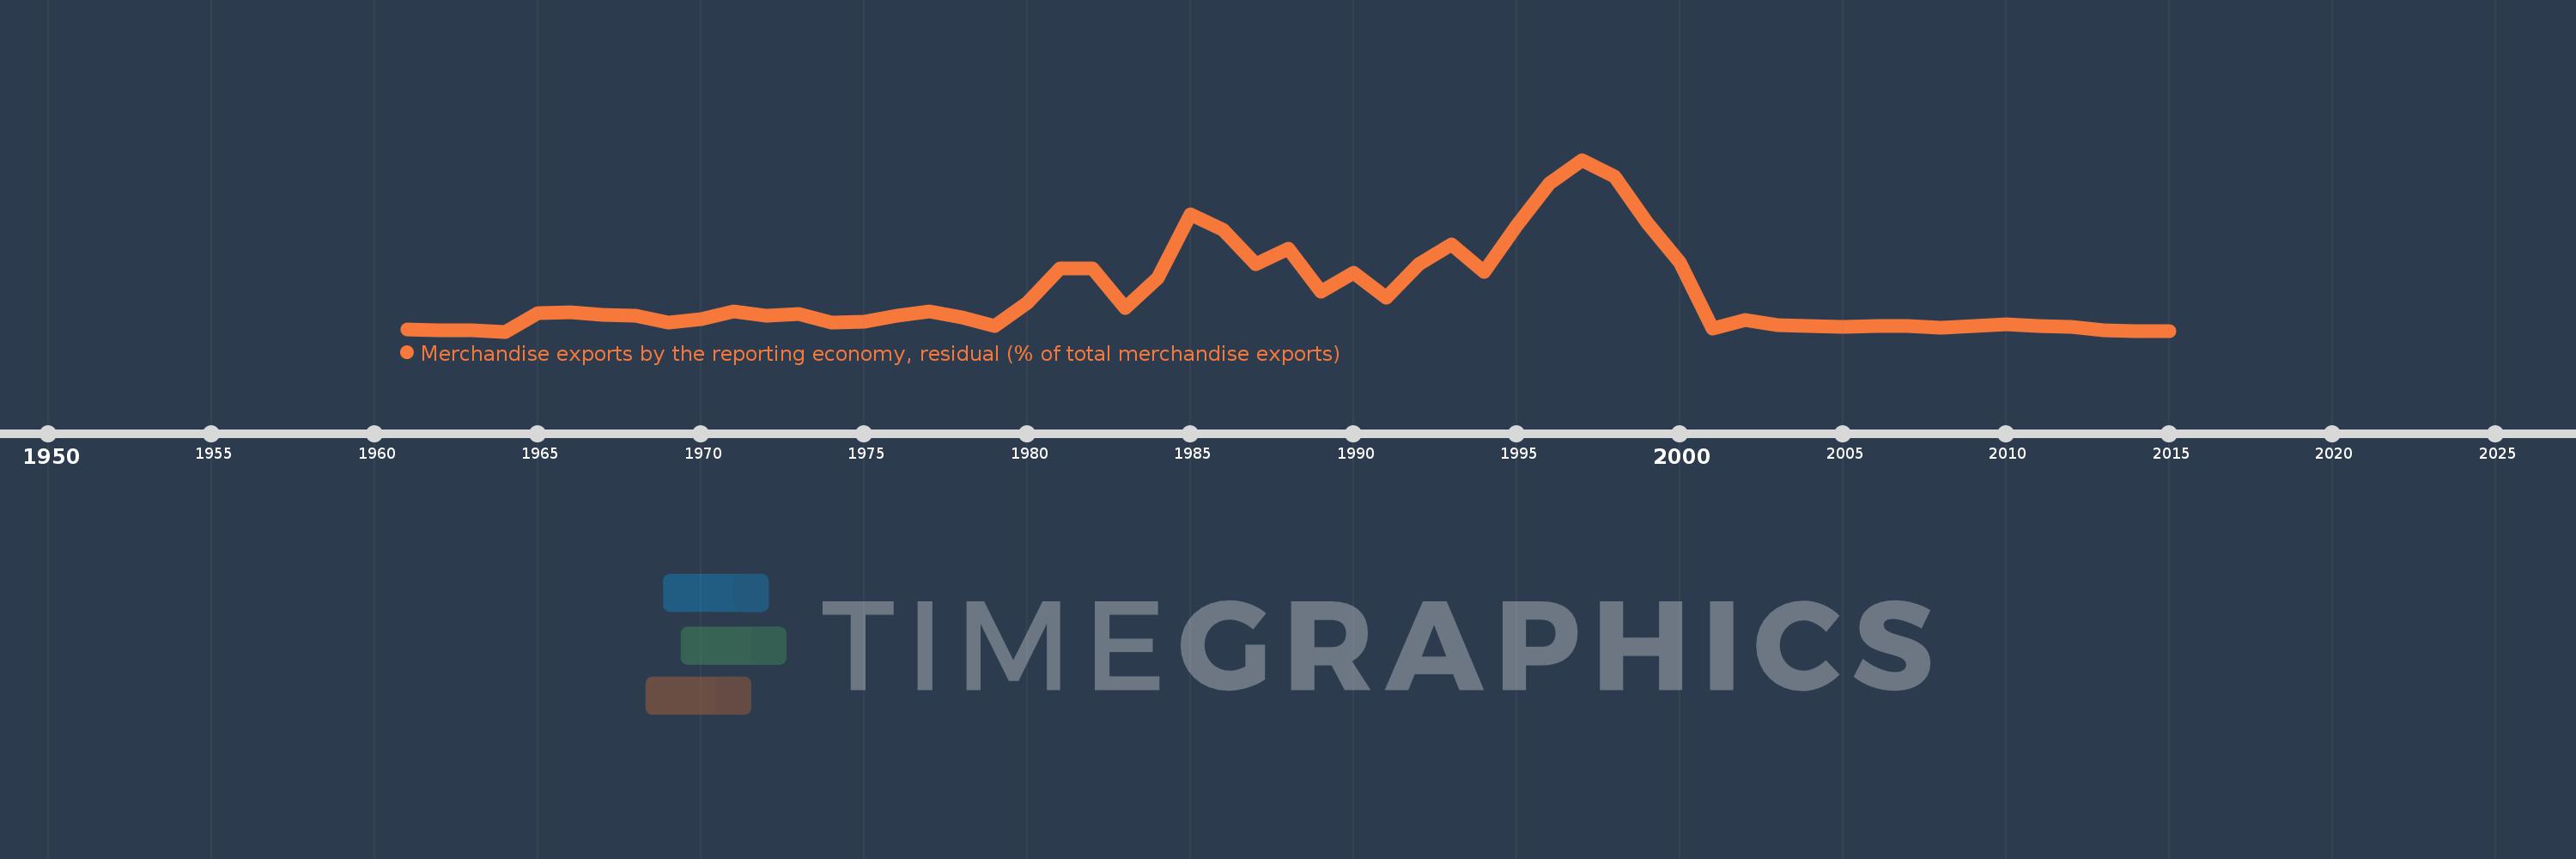
Merchandise exports by the reporting economy, residual (% of total merchandise exports)
2015,2014,2013,2012,2011,2010,2009,2008,2007,2006,2005,2004,2003,2002,2001,2000,1999,1998,1997,1996,1995,1994,1993,1992,1991,1990,1989,1988,1987,1986,1985,1984,1983,1982,1981,1980,1979,1978,1977,1976,1975,1974,1973,1972,1971,1970,1969,1968,1967,1966,1965,1964,1963,1962,1961
Diese Statistik in anderen Ländern:
AfghanistanAlbaniaAlgeriaAmerican SamoaAngolaAntigua and BarbudaArab WorldArgentinaArmeniaArubaAustraliaAustriaAzerbaijanBahamas, TheBahrainBangladeshBarbadosBelarusBelgiumBelizeBeninBermudaBoliviaBosnia and HerzegovinaBrazilBrunei DarussalamBulgariaBurkina FasoBurundiCabo VerdeCambodiaCameroonCanadaCaribbean small statesCentral African RepublicCentral Europe and the BalticsChadChileChinaColombiaComorosCongo, Dem. Rep.Congo, Rep.Costa RicaCote d'IvoireCroatiaCubaCyprusCzech RepublicDenmarkDjiboutiDominicaDominican RepublicEarly-demographic dividendEast Asia & PacificEast Asia & Pacific (excluding high income)East Asia & Pacific (IDA & IBRD countries)EcuadorEgypt, Arab Rep.El SalvadorEquatorial GuineaEstoniaEthiopiaEuro areaEurope & Central AsiaEurope & Central Asia (excluding high income)Europe & Central Asia (IDA & IBRD countries)European UnionFaroe IslandsFijiFinlandFragile and conflict affected situationsFranceFrench PolynesiaGabonGambia, TheGeorgiaGermanyGhanaGibraltarGreeceGreenlandGrenadaGuamGuatemalaGuineaGuinea-BissauGuyanaHaitiHeavily indebted poor countries (HIPC)High incomeHondurasHong Kong SAR, ChinaHungaryIBRD onlyIcelandIDA & IBRD totalIDA blendIDA onlyIDA totalIndiaIndonesiaIran, Islamic Rep.IraqIrelandIsraelItalyJamaicaJapanJordanKazakhstanKenyaKiribatiKorea, Dem. People’s Rep.Korea, Rep.KosovoKuwaitKyrgyz RepublicLao PDRLate-demographic dividendLatin America & Caribbean Latin America & Caribbean (excluding high income)Latin America & the Caribbean (IDA & IBRD countries)LatviaLeast developed countries: UN classificationLebanonLiberiaLibyaLithuaniaLow & middle incomeLow incomeLower middle incomeLuxembourgMacao SAR, ChinaMacedonia, FYRMadagascarMalawiMalaysiaMaldivesMaliMaltaMauritaniaMauritiusMexicoMiddle East & North AfricaMiddle East & North Africa (excluding high income)Middle East & North Africa (IDA & IBRD countries)Middle incomeMoldovaMongoliaMontenegroMoroccoMozambiqueMyanmarNauruNepalNetherlandsNew CaledoniaNew ZealandNicaraguaNigerNigeriaNorth AmericaNorwayOECD membersOmanOther small statesPacific island small statesPakistanPanamaPapua New GuineaParaguayPeruPhilippinesPolandPortugalPost-demographic dividendPre-demographic dividendQatarRomaniaRussian FederationRwandaSamoaSao Tome and PrincipeSaudi ArabiaSenegalSerbiaSeychellesSierra LeoneSingaporeSlovak RepublicSloveniaSmall statesSolomon IslandsSomaliaSouth AfricaSouth AsiaSouth Asia (IDA & IBRD)SpainSri LankaSt. Kitts and NevisSt. LuciaSt. Vincent and the GrenadinesSub-Saharan Africa Sub-Saharan Africa (excluding high income)Sub-Saharan Africa (IDA & IBRD countries)SudanSurinameSwedenSwitzerlandSyrian Arab RepublicTajikistanTanzaniaThailandTogoTongaTrinidad and TobagoTunisiaTurkeyTurkmenistanTuvaluUgandaUkraineUnited Arab EmiratesUnited KingdomUnited StatesUpper middle incomeUruguayUzbekistanVanuatuVenezuela, RBVietnamWorldYemen, Rep.ZambiaZimbabwe Zeitlinie:
Diese Zeitleiste vorliegt die Graphik ab 1961 J. bis 2015 J. Sierra Leone. Die Angaben bis 1960 J. sind nicht vorhanden. Die Zahl aktueller Beobachtungen nach Daten: 55.
Die Quelle (Bezeichnung):
Kennzahlen der Weltentwicklung
Die Quelle (Einrichtung):
World Bank staff estimates based data from International Monetary Fund's Direction of Trade database.
Kategorien:
Private Sector, Trade
Es wurde aktualisiert:
23 Apr 2017 Jahr
Kennzahlen der Wertänderungen vom Jahr zum Jahr
Minimum:
0.563
1 Jan 1964 Jahr
Maximum:
81.37
1 Jan 1997 Jahr
Zum Datum der Beobachtung
Wert
Absolute Veränderung
Die Veränderung bezüglich dem vorherigen Wert
1 Jan 1961 Jahr
1.377
+1.377
0.0%
1 Jan 1962 Jahr
0.993
-0.385
-27.91%
1 Jan 1963 Jahr
1.288
+0.295
29.68%
1 Jan 1964 Jahr
0.563
-0.725
-56.31%
1 Jan 1965 Jahr
9.378
+8.816
1.57 Tsnd.%
1 Jan 1966 Jahr
9.501
+0.122
1.3%
1 Jan 1967 Jahr
8.354
-1.147
-12.07%
1 Jan 1968 Jahr
7.88
-0.474
-5.67%
1 Jan 1969 Jahr
4.932
-2.948
-37.41%
1 Jan 1970 Jahr
6.489
+1.557
31.57%
1 Jan 1971 Jahr
10.028
+3.539
54.54%
1 Jan 1972 Jahr
7.865
-2.164
-21.58%
1 Jan 1973 Jahr
8.786
+0.921
11.71%
1 Jan 1974 Jahr
4.609
-4.177
-47.54%
1 Jan 1975 Jahr
5.017
+0.409
8.87%
1 Jan 1976 Jahr
7.872
+2.854
56.89%
1 Jan 1977 Jahr
10.132
+2.26
28.71%
1 Jan 1978 Jahr
7.377
-2.755
-27.2%
1 Jan 1979 Jahr
3.277
-4.1
-55.58%
1 Jan 1980 Jahr
14.262
+10.985
335.26%
1 Jan 1981 Jahr
30.189
+15.927
111.67%
1 Jan 1982 Jahr
30.189
0.0
0.0%
1 Jan 1983 Jahr
11.782
-18.407
-60.97%
1 Jan 1984 Jahr
25.857
+14.075
119.47%
1 Jan 1985 Jahr
55.794
+29.936
115.78%
1 Jan 1986 Jahr
48.321
-7.473
-13.39%
1 Jan 1987 Jahr
32.268
-16.053
-33.22%
1 Jan 1988 Jahr
39.733
+7.465
23.14%
1 Jan 1989 Jahr
19.217
-20.516
-51.63%
1 Jan 1990 Jahr
28.288
+9.071
47.2%
1 Jan 1991 Jahr
16.533
-11.756
-41.56%
1 Jan 1992 Jahr
32.084
+15.552
94.07%
1 Jan 1993 Jahr
41.754
+9.669
30.14%
1 Jan 1994 Jahr
28.547
-13.207
-31.63%
1 Jan 1995 Jahr
50.625
+22.078
77.34%
1 Jan 1996 Jahr
70.393
+19.768
39.05%
1 Jan 1997 Jahr
81.37
+10.978
15.59%
1 Jan 1998 Jahr
73.494
-7.876
-9.68%
1 Jan 1999 Jahr
51.541
-21.953
-29.87%
1 Jan 2000 Jahr
33.099
-18.442
-35.78%
1 Jan 2001 Jahr
2.117
-30.982
-93.6%
1 Jan 2002 Jahr
5.847
+3.729
176.13%
1 Jan 2003 Jahr
3.646
-2.201
-37.65%
1 Jan 2004 Jahr
3.24
-0.406
-11.13%
1 Jan 2005 Jahr
2.881
-0.359
-11.09%
1 Jan 2006 Jahr
3.047
+0.167
5.78%
1 Jan 2007 Jahr
3.255
+0.208
6.83%
1 Jan 2008 Jahr
2.506
-0.749
-23.02%
1 Jan 2009 Jahr
3.089
+0.583
23.27%
1 Jan 2010 Jahr
4.083
+0.994
32.16%
1 Jan 2011 Jahr
3.339
-0.744
-18.22%
1 Jan 2012 Jahr
2.947
-0.392
-11.74%
1 Jan 2013 Jahr
1.244
-1.703
-57.78%
1 Jan 2014 Jahr
0.714
-0.531
-42.64%
1 Jan 2015 Jahr
0.633
-0.081
-11.33%
Bewertung der Länder gemäß mit laufender Statistik nach Jahren


Kommentare: