29
/de/
de
AIzaSyAYiBZKx7MnpbEhh9jyipgxe19OcubqV5w
April 1, 2024
53393
Other small states
OSS
false
2
1
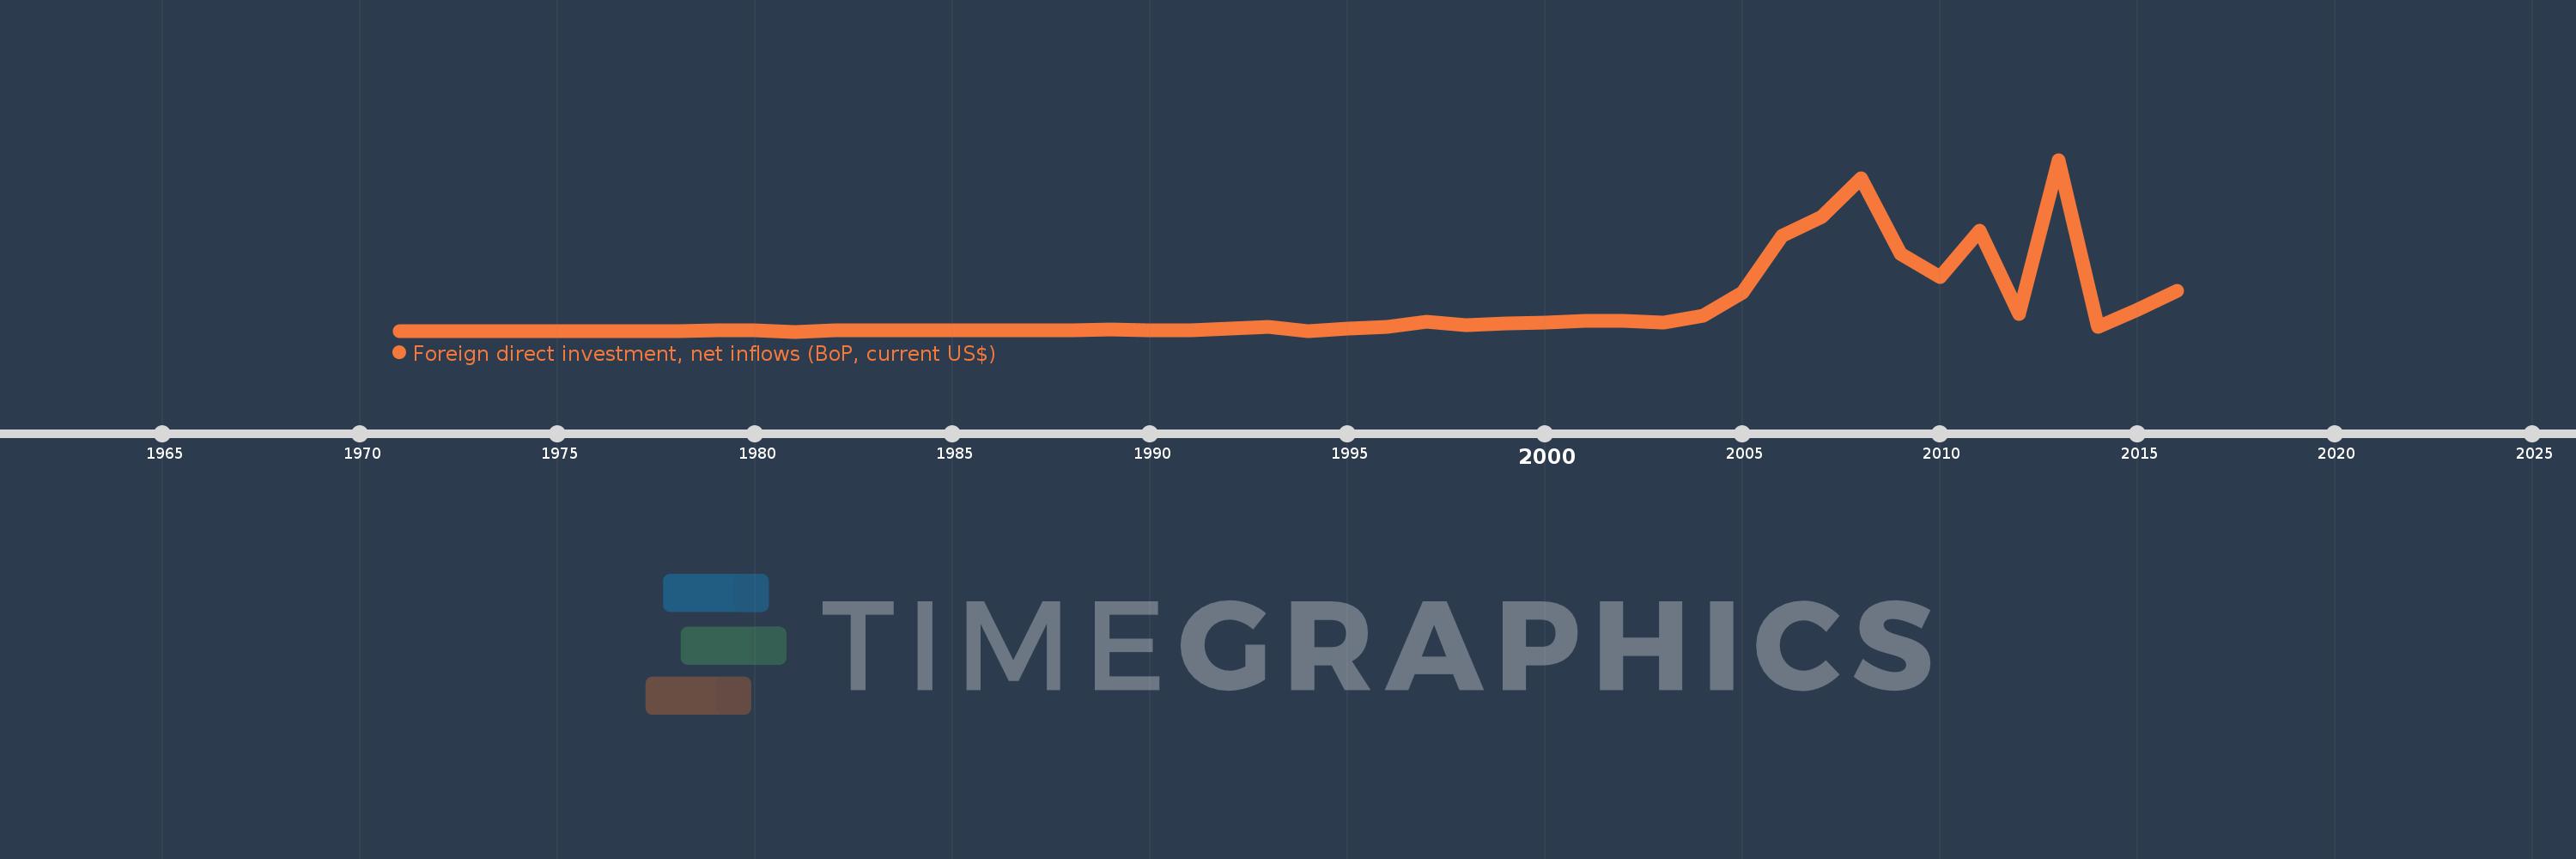
Foreign direct investment, net inflows (BoP, current US$)
2016,2015,2014,2013,2012,2011,2010,2009,2008,2007,2006,2005,2004,2003,2002,2001,2000,1999,1998,1997,1996,1995,1994,1993,1992,1991,1990,1989,1988,1987,1986,1985,1984,1983,1982,1981,1980,1979,1978,1977,1976,1975,1974,1973,1972,1971
Diese Statistik in anderen Ländern:
AfghanistanAlbaniaAlgeriaAngolaAntigua and BarbudaArab WorldArgentinaArmeniaArubaAustraliaAustriaAzerbaijanBahamas, TheBahrainBangladeshBarbadosBelarusBelgiumBelizeBeninBermudaBhutanBoliviaBosnia and HerzegovinaBotswanaBrazilBritish Virgin IslandsBrunei DarussalamBulgariaBurkina FasoBurundiCabo VerdeCambodiaCameroonCanadaCaribbean small statesCayman IslandsCentral African RepublicCentral Europe and the BalticsChadChileChinaColombiaComorosCongo, Dem. Rep.Congo, Rep.Costa RicaCote d'IvoireCroatiaCuracaoCyprusCzech RepublicDenmarkDjiboutiDominicaDominican RepublicEarly-demographic dividendEast Asia & PacificEast Asia & Pacific (excluding high income)East Asia & Pacific (IDA & IBRD countries)EcuadorEgypt, Arab Rep.El SalvadorEquatorial GuineaEritreaEstoniaEthiopiaEuro areaEurope & Central AsiaEurope & Central Asia (excluding high income)Europe & Central Asia (IDA & IBRD countries)European UnionFijiFinlandFragile and conflict affected situationsFranceFrench PolynesiaGabonGambia, TheGeorgiaGermanyGhanaGibraltarGreeceGrenadaGuatemalaGuineaGuinea-BissauGuyanaHaitiHeavily indebted poor countries (HIPC)High incomeHondurasHong Kong SAR, ChinaHungaryIBRD onlyIcelandIDA & IBRD totalIDA blendIDA onlyIDA totalIndiaIndonesiaIran, Islamic Rep.IraqIrelandIsraelItalyJamaicaJapanJordanKazakhstanKenyaKiribatiKorea, Dem. People’s Rep.Korea, Rep.KosovoKuwaitKyrgyz RepublicLao PDRLate-demographic dividendLatin America & Caribbean Latin America & Caribbean (excluding high income)Latin America & the Caribbean (IDA & IBRD countries)LatviaLeast developed countries: UN classificationLebanonLesothoLiberiaLibyaLithuaniaLow & middle incomeLow incomeLower middle incomeLuxembourgMacao SAR, ChinaMacedonia, FYRMadagascarMalawiMalaysiaMaldivesMaliMaltaMarshall IslandsMauritaniaMauritiusMexicoMicronesia, Fed. Sts.Middle East & North AfricaMiddle East & North Africa (excluding high income)Middle East & North Africa (IDA & IBRD countries)Middle incomeMoldovaMongoliaMontenegroMoroccoMozambiqueMyanmarNamibiaNauruNepalNetherlandsNew CaledoniaNew ZealandNicaraguaNigerNigeriaNorth AmericaNorthern Mariana IslandsNorwayOECD membersOmanOther small statesPacific island small statesPakistanPalauPanamaPapua New GuineaParaguayPeruPhilippinesPolandPortugalPost-demographic dividendPre-demographic dividendQatarRomaniaRussian FederationRwandaSamoaSao Tome and PrincipeSaudi ArabiaSenegalSerbiaSeychellesSierra LeoneSingaporeSint Maarten (Dutch part)Slovak RepublicSloveniaSmall statesSolomon IslandsSomaliaSouth AfricaSouth AsiaSouth Asia (IDA & IBRD)South SudanSpainSri LankaSt. Kitts and NevisSt. LuciaSt. Vincent and the GrenadinesSub-Saharan Africa Sub-Saharan Africa (excluding high income)Sub-Saharan Africa (IDA & IBRD countries)SudanSurinameSwazilandSwedenSwitzerlandSyrian Arab RepublicTajikistanTanzaniaThailandTimor-LesteTogoTongaTrinidad and TobagoTunisiaTurkeyTurkmenistanTuvaluUgandaUkraineUnited Arab EmiratesUnited KingdomUnited StatesUpper middle incomeUruguayUzbekistanVanuatuVenezuela, RBVietnamWest Bank and GazaWorldYemen, Rep.ZambiaZimbabwe Zeitlinie:
Diese Zeitleiste vorliegt die Graphik ab 1971 J. bis 2016 J. Other small states. Die Angaben bis 1970 J. sind nicht vorhanden. Die Zahl aktueller Beobachtungen nach Daten: 46.
Die Quelle (Bezeichnung):
Kennzahlen der Weltentwicklung
Die Quelle (Einrichtung):
International Monetary Fund, Balance of Payments database, supplemented by data from the United Nations Conference on Trade and Development and official national sources.
Kategorien:
Economy & Growth, Financial Sector, External Debt
Es wurde aktualisiert:
23 Apr 2017 Jahr
Kennzahlen der Wertänderungen vom Jahr zum Jahr
im Durchschnitt:
7.955 Mlrd.
Minimum:
-88.431 Mln.
1 Jan 1981 Jahr
Maximum:
63.058 Mlrd.
1 Jan 2013 Jahr
Zum Datum der Beobachtung
Wert
Absolute Veränderung
Die Veränderung bezüglich dem vorherigen Wert
1 Jan 1971 Jahr
29.69 Mln.
+29.69 Mln.
0.0%
1 Jan 1972 Jahr
71.595 Mln.
+41.905 Mln.
141.14%
1 Jan 1973 Jahr
44.445 Mln.
-27.15 Mln.
-37.92%
1 Jan 1974 Jahr
53.792 Mln.
+9.347 Mln.
21.03%
1 Jan 1975 Jahr
65.058 Mln.
+11.266 Mln.
20.94%
1 Jan 1976 Jahr
30.913 Mln.
-34.145 Mln.
-52.48%
1 Jan 1977 Jahr
82.711 Mln.
+51.798 Mln.
167.56%
1 Jan 1978 Jahr
110.008 Mln.
+27.296 Mln.
33.0%
1 Jan 1979 Jahr
251.321 Mln.
+141.313 Mln.
128.46%
1 Jan 1980 Jahr
500.094 Mln.
+248.773 Mln.
98.99%
1 Jan 1981 Jahr
-88.431 Mln.
-588.525 Mln.
-117.68%
1 Jan 1982 Jahr
375.977 Mln.
+464.408 Mln.
-525.17%
1 Jan 1983 Jahr
312.329 Mln.
-63.648 Mln.
-16.93%
1 Jan 1984 Jahr
280.406 Mln.
-31.923 Mln.
-10.22%
1 Jan 1985 Jahr
313.31 Mln.
+32.904 Mln.
11.73%
1 Jan 1986 Jahr
314.381 Mln.
+1.07 Mln.
0.34%
1 Jan 1987 Jahr
297.623 Mln.
-16.758 Mln.
-5.33%
1 Jan 1988 Jahr
355.576 Mln.
+57.954 Mln.
19.47%
1 Jan 1989 Jahr
587.226 Mln.
+231.65 Mln.
65.15%
1 Jan 1990 Jahr
447.249 Mln.
-139.978 Mln.
-23.84%
1 Jan 1991 Jahr
359.165 Mln.
-88.083 Mln.
-19.69%
1 Jan 1992 Jahr
1.09 Mlrd.
+730.522 Mln.
203.39%
1 Jan 1993 Jahr
1.508 Mlrd.
+418.116 Mln.
38.37%
1 Jan 1994 Jahr
-77.224 Mln.
-1.585 Mlrd.
-105.12%
1 Jan 1995 Jahr
936.58 Mln.
+1.014 Mlrd.
-1.31 Tsnd.%
1 Jan 1996 Jahr
1.562 Mlrd.
+624.947 Mln.
66.73%
1 Jan 1997 Jahr
3.664 Mlrd.
+2.103 Mlrd.
134.66%
1 Jan 1998 Jahr
2.134 Mlrd.
-1.53 Mlrd.
-41.76%
1 Jan 1999 Jahr
3.014 Mlrd.
+880.031 Mln.
41.24%
1 Jan 2000 Jahr
3.084 Mlrd.
+69.897 Mln.
2.32%
1 Jan 2001 Jahr
4.01 Mlrd.
+925.846 Mln.
30.02%
1 Jan 2002 Jahr
3.991 Mlrd.
-18.614 Mln.
-0.46%
1 Jan 2003 Jahr
3.337 Mlrd.
-654.517 Mln.
-16.4%
1 Jan 2004 Jahr
5.823 Mlrd.
+2.486 Mlrd.
74.52%
1 Jan 2005 Jahr
14.144 Mlrd.
+8.321 Mlrd.
142.9%
1 Jan 2006 Jahr
35.222 Mlrd.
+21.078 Mlrd.
149.02%
1 Jan 2007 Jahr
42.107 Mlrd.
+6.884 Mlrd.
19.55%
1 Jan 2008 Jahr
56.152 Mlrd.
+14.046 Mlrd.
33.36%
1 Jan 2009 Jahr
28.354 Mlrd.
-27.798 Mlrd.
-49.51%
1 Jan 2010 Jahr
20.048 Mlrd.
-8.306 Mlrd.
-29.29%
1 Jan 2011 Jahr
36.98 Mlrd.
+16.932 Mlrd.
84.46%
1 Jan 2012 Jahr
6.422 Mlrd.
-30.558 Mlrd.
-82.63%
1 Jan 2013 Jahr
63.058 Mlrd.
+56.636 Mlrd.
881.86%
1 Jan 2014 Jahr
1.562 Mlrd.
-61.496 Mlrd.
-97.52%
1 Jan 2015 Jahr
8.103 Mlrd.
+6.541 Mlrd.
418.75%
1 Jan 2016 Jahr
14.917 Mlrd.
+6.813 Mlrd.
84.08%
Bewertung der Länder gemäß mit laufender Statistik nach Jahren


Kommentare: