29
/de/
de
AIzaSyAYiBZKx7MnpbEhh9jyipgxe19OcubqV5w
April 1, 2024
116870
Cyprus
CYP
true
2
1
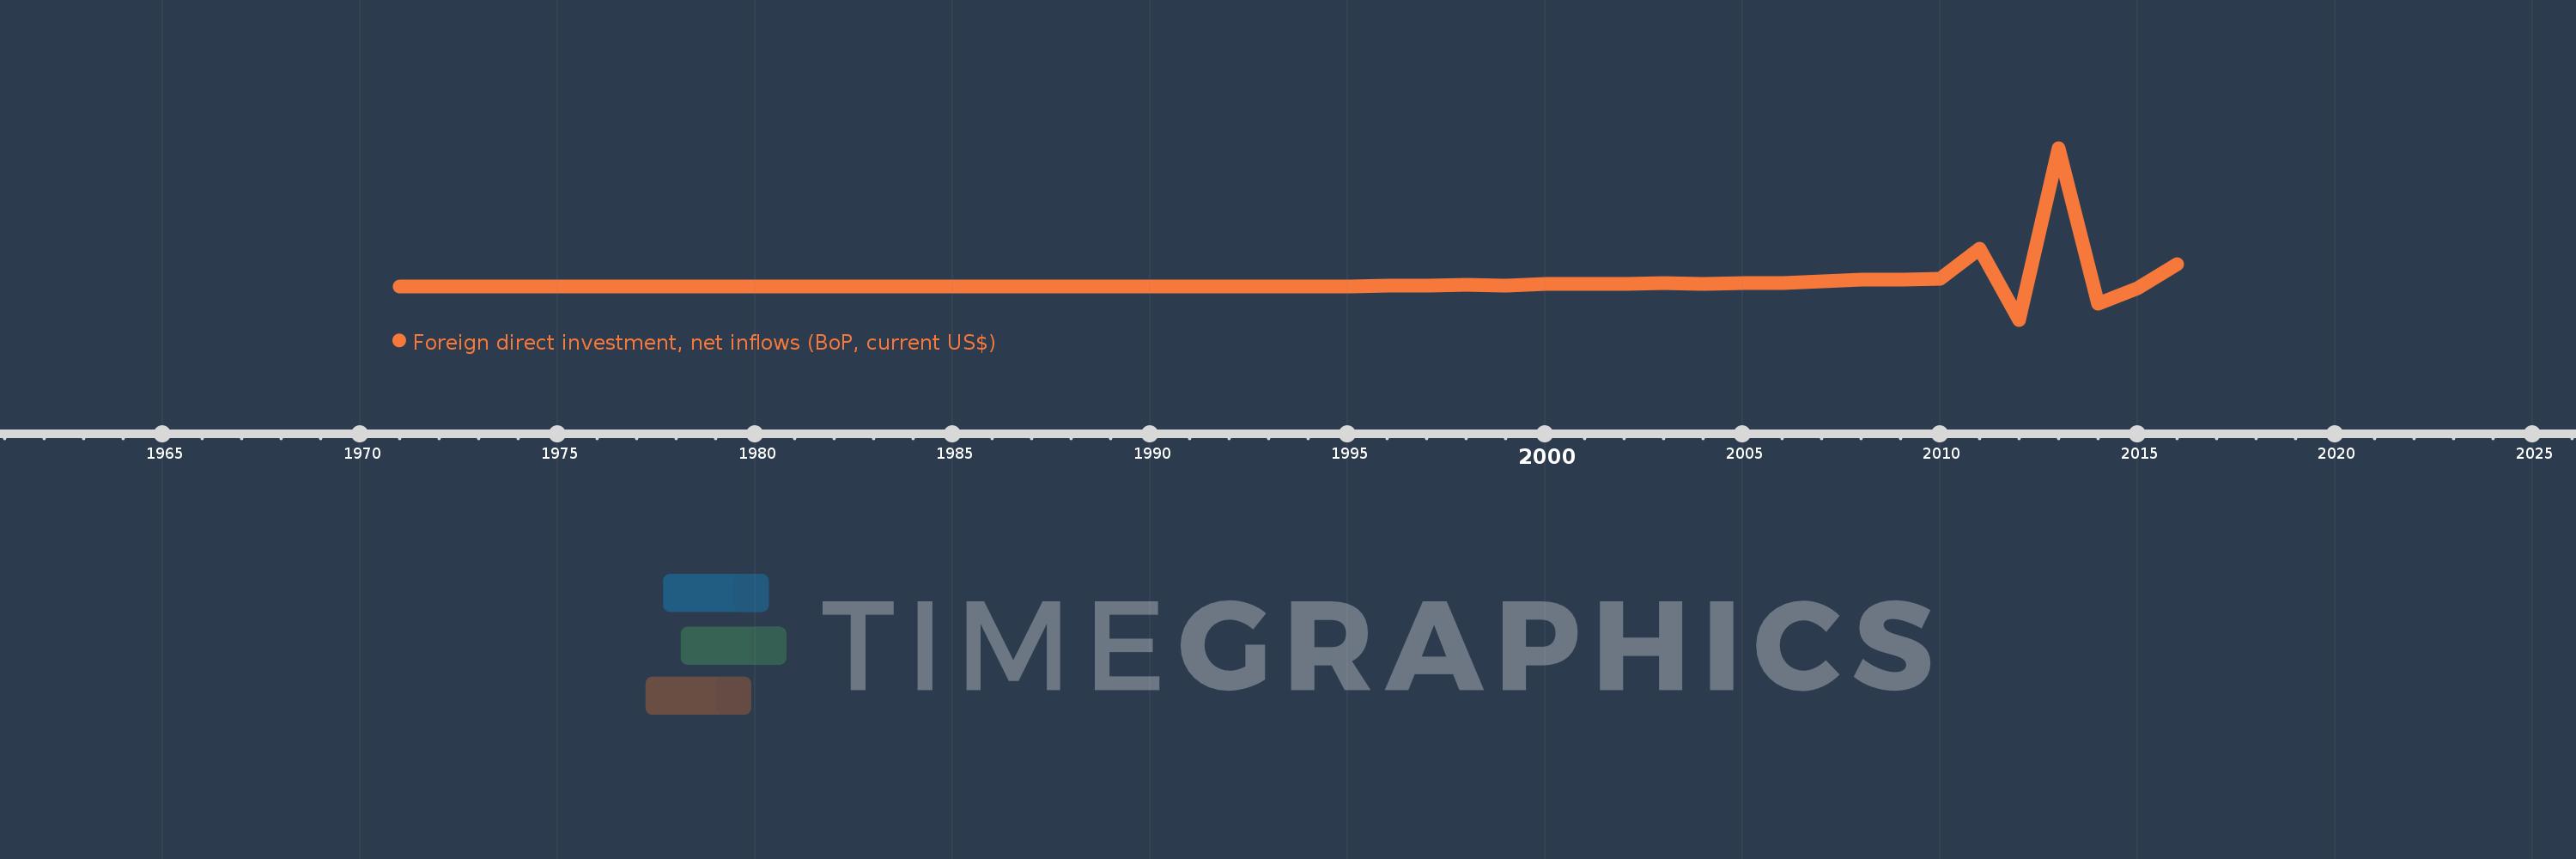
Foreign direct investment, net inflows (BoP, current US$)
2016,2015,2014,2013,2012,2011,2010,2009,2008,2007,2006,2005,2004,2003,2002,2001,2000,1999,1998,1997,1996,1995,1994,1993,1992,1991,1990,1989,1988,1987,1986,1985,1984,1983,1982,1981,1980,1979,1978,1977,1976,1975,1974,1973,1972,1971
Diese Statistik in anderen Ländern:
AfghanistanAlbaniaAlgeriaAngolaAntigua and BarbudaArab WorldArgentinaArmeniaArubaAustraliaAustriaAzerbaijanBahamas, TheBahrainBangladeshBarbadosBelarusBelgiumBelizeBeninBermudaBhutanBoliviaBosnia and HerzegovinaBotswanaBrazilBritish Virgin IslandsBrunei DarussalamBulgariaBurkina FasoBurundiCabo VerdeCambodiaCameroonCanadaCaribbean small statesCayman IslandsCentral African RepublicCentral Europe and the BalticsChadChileChinaColombiaComorosCongo, Dem. Rep.Congo, Rep.Costa RicaCote d'IvoireCroatiaCuracaoCyprusCzech RepublicDenmarkDjiboutiDominicaDominican RepublicEarly-demographic dividendEast Asia & PacificEast Asia & Pacific (excluding high income)East Asia & Pacific (IDA & IBRD countries)EcuadorEgypt, Arab Rep.El SalvadorEquatorial GuineaEritreaEstoniaEthiopiaEuro areaEurope & Central AsiaEurope & Central Asia (excluding high income)Europe & Central Asia (IDA & IBRD countries)European UnionFijiFinlandFragile and conflict affected situationsFranceFrench PolynesiaGabonGambia, TheGeorgiaGermanyGhanaGibraltarGreeceGrenadaGuatemalaGuineaGuinea-BissauGuyanaHaitiHeavily indebted poor countries (HIPC)High incomeHondurasHong Kong SAR, ChinaHungaryIBRD onlyIcelandIDA & IBRD totalIDA blendIDA onlyIDA totalIndiaIndonesiaIran, Islamic Rep.IraqIrelandIsraelItalyJamaicaJapanJordanKazakhstanKenyaKiribatiKorea, Dem. People’s Rep.Korea, Rep.KosovoKuwaitKyrgyz RepublicLao PDRLate-demographic dividendLatin America & Caribbean Latin America & Caribbean (excluding high income)Latin America & the Caribbean (IDA & IBRD countries)LatviaLeast developed countries: UN classificationLebanonLesothoLiberiaLibyaLithuaniaLow & middle incomeLow incomeLower middle incomeLuxembourgMacao SAR, ChinaMacedonia, FYRMadagascarMalawiMalaysiaMaldivesMaliMaltaMarshall IslandsMauritaniaMauritiusMexicoMicronesia, Fed. Sts.Middle East & North AfricaMiddle East & North Africa (excluding high income)Middle East & North Africa (IDA & IBRD countries)Middle incomeMoldovaMongoliaMontenegroMoroccoMozambiqueMyanmarNamibiaNauruNepalNetherlandsNew CaledoniaNew ZealandNicaraguaNigerNigeriaNorth AmericaNorthern Mariana IslandsNorwayOECD membersOmanOther small statesPacific island small statesPakistanPalauPanamaPapua New GuineaParaguayPeruPhilippinesPolandPortugalPost-demographic dividendPre-demographic dividendQatarRomaniaRussian FederationRwandaSamoaSao Tome and PrincipeSaudi ArabiaSenegalSerbiaSeychellesSierra LeoneSingaporeSint Maarten (Dutch part)Slovak RepublicSloveniaSmall statesSolomon IslandsSomaliaSouth AfricaSouth AsiaSouth Asia (IDA & IBRD)South SudanSpainSri LankaSt. Kitts and NevisSt. LuciaSt. Vincent and the GrenadinesSub-Saharan Africa Sub-Saharan Africa (excluding high income)Sub-Saharan Africa (IDA & IBRD countries)SudanSurinameSwazilandSwedenSwitzerlandSyrian Arab RepublicTajikistanTanzaniaThailandTimor-LesteTogoTongaTrinidad and TobagoTunisiaTurkeyTurkmenistanTuvaluUgandaUkraineUnited Arab EmiratesUnited KingdomUnited StatesUpper middle incomeUruguayUzbekistanVanuatuVenezuela, RBVietnamWest Bank and GazaWorldYemen, Rep.ZambiaZimbabwe Zeitlinie:
Diese Zeitleiste vorliegt die Graphik ab 1971 J. bis 2016 J. Cyprus. Die Angaben bis 1970 J. sind nicht vorhanden. Die Zahl aktueller Beobachtungen nach Daten: 46.
Die Quelle (Bezeichnung):
Kennzahlen der Weltentwicklung
Die Quelle (Einrichtung):
International Monetary Fund, Balance of Payments database, supplemented by data from the United Nations Conference on Trade and Development and official national sources.
Kategorien:
Economy & Growth, Financial Sector, External Debt
Es wurde aktualisiert:
23 Apr 2017 Jahr
Kennzahlen der Wertänderungen vom Jahr zum Jahr
im Durchschnitt:
1.557 Mlrd.
Minimum:
-11.921 Mlrd.
1 Jan 2012 Jahr
Maximum:
49.601 Mlrd.
1 Jan 2013 Jahr
Zum Datum der Beobachtung
Wert
Absolute Veränderung
Die Veränderung bezüglich dem vorherigen Wert
1 Jan 1971 Jahr
20.2 Mln.
+20.2 Mln.
0.0%
1 Jan 1972 Jahr
29.6 Mln.
+9.4 Mln.
46.53%
1 Jan 1973 Jahr
36.4 Mln.
+6.8 Mln.
22.97%
1 Jan 1974 Jahr
37.2 Mln.
+800.0 Tsnd.
2.2%
1 Jan 1975 Jahr
32.4 Mln.
-4.8 Mln.
-12.9%
1 Jan 1976 Jahr
18.1 Mln.
-14.3 Mln.
-44.14%
1 Jan 1977 Jahr
32.4 Mln.
+14.3 Mln.
79.0%
1 Jan 1978 Jahr
41.409 Mln.
+9.009 Mln.
27.81%
1 Jan 1979 Jahr
57.026 Mln.
+15.617 Mln.
37.71%
1 Jan 1980 Jahr
70.533 Mln.
+13.507 Mln.
23.69%
1 Jan 1981 Jahr
84.973 Mln.
+14.44 Mln.
20.47%
1 Jan 1982 Jahr
78.305 Mln.
-6.669 Mln.
-7.85%
1 Jan 1983 Jahr
71.521 Mln.
-6.784 Mln.
-8.66%
1 Jan 1984 Jahr
68.358 Mln.
-3.163 Mln.
-4.42%
1 Jan 1985 Jahr
52.687 Mln.
-15.671 Mln.
-22.93%
1 Jan 1986 Jahr
57.954 Mln.
+5.268 Mln.
10.0%
1 Jan 1987 Jahr
46.319 Mln.
-11.635 Mln.
-20.08%
1 Jan 1988 Jahr
51.965 Mln.
+5.645 Mln.
12.19%
1 Jan 1989 Jahr
62.148 Mln.
+10.183 Mln.
19.6%
1 Jan 1990 Jahr
69.75 Mln.
+7.602 Mln.
12.23%
1 Jan 1991 Jahr
126.615 Mln.
+56.866 Mln.
81.53%
1 Jan 1992 Jahr
81.821 Mln.
-44.794 Mln.
-35.38%
1 Jan 1993 Jahr
107.441 Mln.
+25.62 Mln.
31.31%
1 Jan 1994 Jahr
83.433 Mln.
-24.008 Mln.
-22.35%
1 Jan 1995 Jahr
75.174 Mln.
-8.259 Mln.
-9.9%
1 Jan 1996 Jahr
243.137 Mln.
+167.963 Mln.
223.43%
1 Jan 1997 Jahr
233.749 Mln.
-9.387 Mln.
-3.86%
1 Jan 1998 Jahr
546.519 Mln.
+312.77 Mln.
133.81%
1 Jan 1999 Jahr
345.398 Mln.
-201.121 Mln.
-36.8%
1 Jan 2000 Jahr
813.054 Mln.
+467.656 Mln.
135.4%
1 Jan 2001 Jahr
854.874 Mln.
+41.82 Mln.
5.14%
1 Jan 2002 Jahr
944.743 Mln.
+89.869 Mln.
10.51%
1 Jan 2003 Jahr
1.103 Mlrd.
+158.707 Mln.
16.8%
1 Jan 2004 Jahr
908.148 Mln.
-195.302 Mln.
-17.7%
1 Jan 2005 Jahr
1.119 Mlrd.
+210.694 Mln.
23.2%
1 Jan 2006 Jahr
1.162 Mlrd.
+43.132 Mln.
3.86%
1 Jan 2007 Jahr
1.872 Mlrd.
+710.419 Mln.
61.14%
1 Jan 2008 Jahr
2.295 Mlrd.
+423.062 Mln.
22.59%
1 Jan 2009 Jahr
2.338 Mlrd.
+42.498 Mln.
1.85%
1 Jan 2010 Jahr
2.831 Mlrd.
+492.63 Mln.
21.07%
1 Jan 2011 Jahr
13.597 Mlrd.
+10.766 Mlrd.
380.35%
1 Jan 2012 Jahr
-11.921 Mlrd.
-25.517 Mlrd.
-187.67%
1 Jan 2013 Jahr
49.601 Mlrd.
+61.521 Mlrd.
-516.09%
1 Jan 2014 Jahr
-6.025 Mlrd.
-55.626 Mlrd.
-112.15%
1 Jan 2015 Jahr
-754.355 Mln.
+5.271 Mlrd.
-87.48%
1 Jan 2016 Jahr
8.011 Mlrd.
+8.765 Mlrd.
-1.16 Tsnd.%
Bewertung der Länder gemäß mit laufender Statistik nach Jahren


Kommentare: