29
/de/
de
AIzaSyAYiBZKx7MnpbEhh9jyipgxe19OcubqV5w
April 1, 2024
52802
OECD members
OED
false
2
1
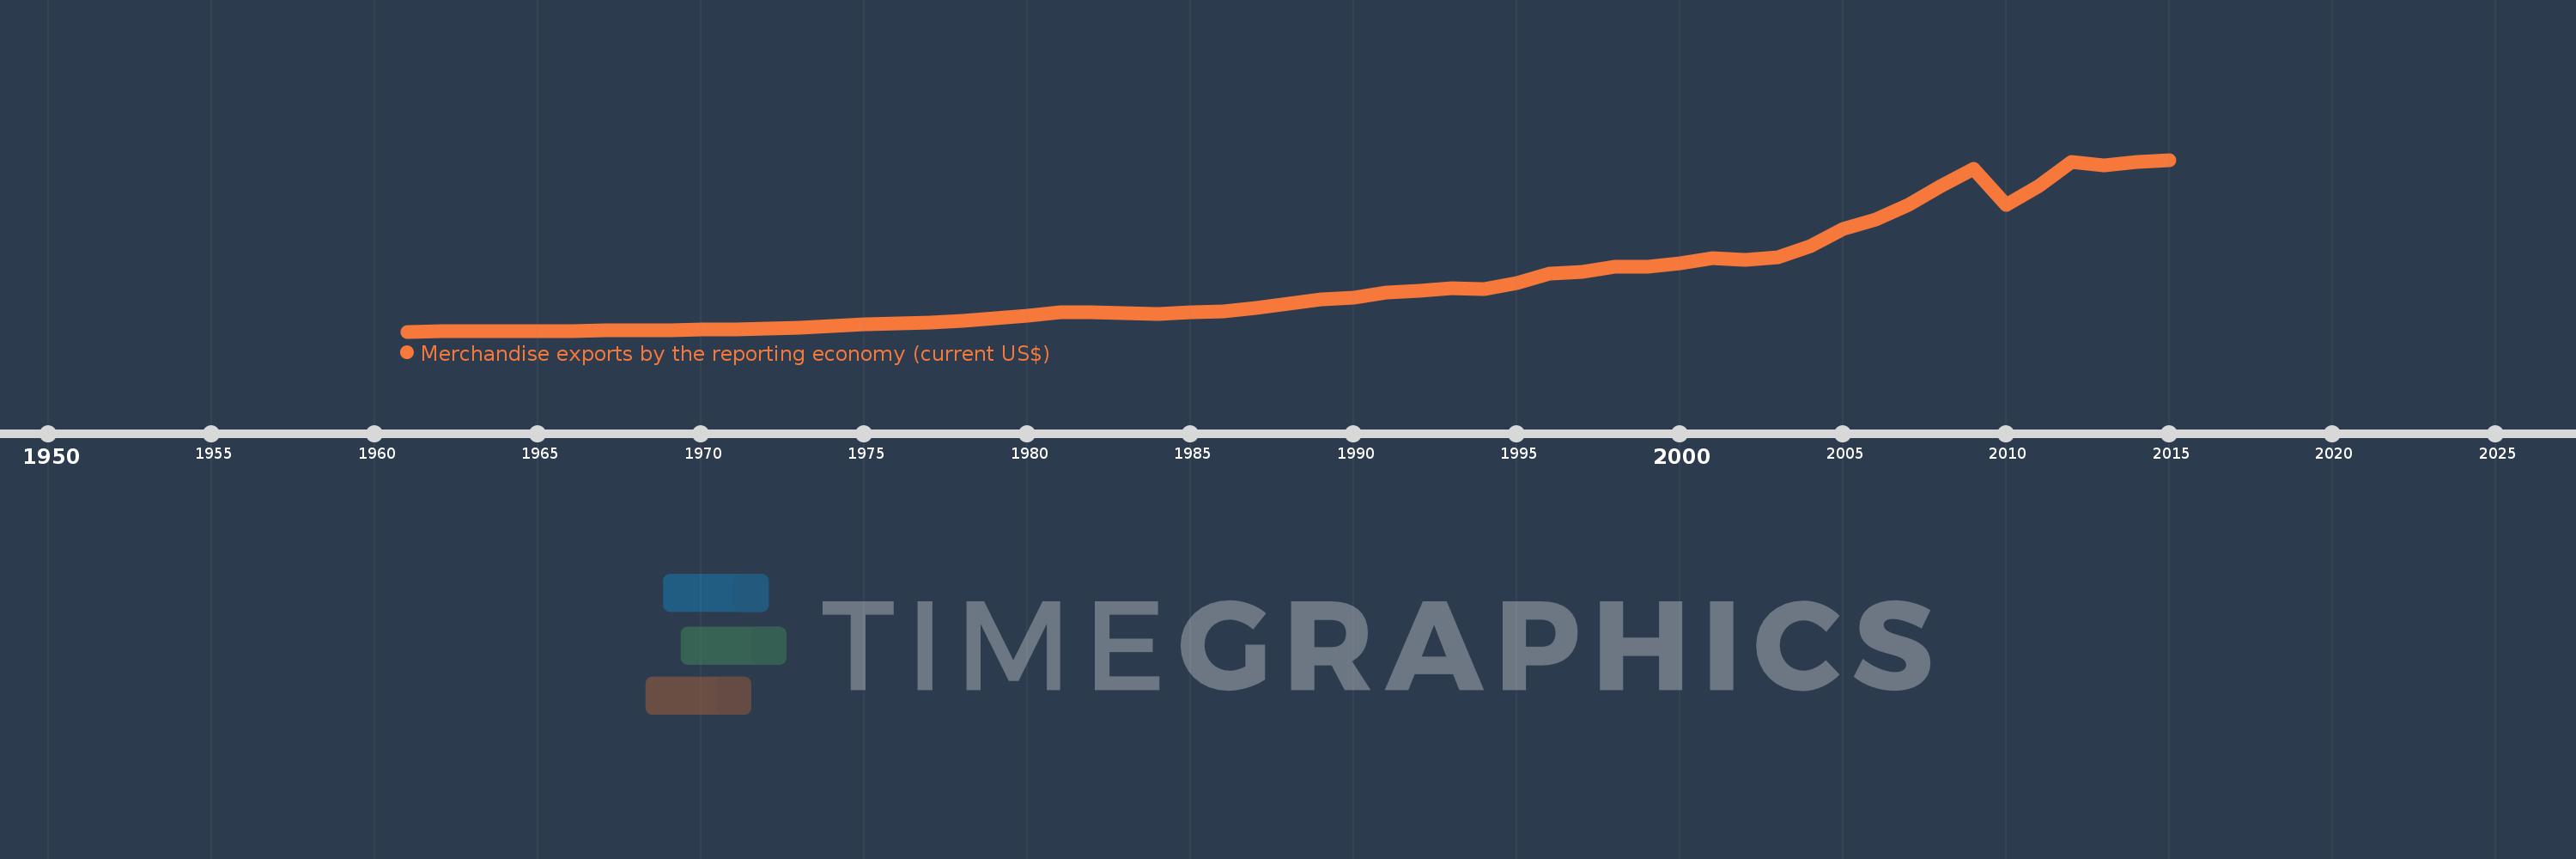
Merchandise exports by the reporting economy (current US$)
2015,2014,2013,2012,2011,2010,2009,2008,2007,2006,2005,2004,2003,2002,2001,2000,1999,1998,1997,1996,1995,1994,1993,1992,1991,1990,1989,1988,1987,1986,1985,1984,1983,1982,1981,1980,1979,1978,1977,1976,1975,1974,1973,1972,1971,1970,1969,1968,1967,1966,1965,1964,1963,1962,1961
Diese Statistik in anderen Ländern:
AfghanistanAlbaniaAlgeriaAmerican SamoaAngolaAntigua and BarbudaArab WorldArgentinaArmeniaArubaAustraliaAustriaAzerbaijanBahamas, TheBahrainBangladeshBarbadosBelarusBelgiumBelizeBeninBermudaBoliviaBosnia and HerzegovinaBrazilBrunei DarussalamBulgariaBurkina FasoBurundiCabo VerdeCambodiaCameroonCanadaCaribbean small statesCentral African RepublicCentral Europe and the BalticsChadChileChinaColombiaComorosCongo, Dem. Rep.Congo, Rep.Costa RicaCote d'IvoireCroatiaCubaCyprusCzech RepublicDenmarkDjiboutiDominicaDominican RepublicEarly-demographic dividendEast Asia & PacificEast Asia & Pacific (excluding high income)East Asia & Pacific (IDA & IBRD countries)EcuadorEgypt, Arab Rep.El SalvadorEquatorial GuineaEstoniaEthiopiaEuro areaEurope & Central AsiaEurope & Central Asia (excluding high income)Europe & Central Asia (IDA & IBRD countries)European UnionFaroe IslandsFijiFinlandFragile and conflict affected situationsFranceFrench PolynesiaGabonGambia, TheGeorgiaGermanyGhanaGibraltarGreeceGreenlandGrenadaGuamGuatemalaGuineaGuinea-BissauGuyanaHaitiHeavily indebted poor countries (HIPC)High incomeHondurasHong Kong SAR, ChinaHungaryIBRD onlyIcelandIDA & IBRD totalIDA blendIDA onlyIDA totalIndiaIndonesiaIran, Islamic Rep.IraqIrelandIsraelItalyJamaicaJapanJordanKazakhstanKenyaKiribatiKorea, Dem. People’s Rep.Korea, Rep.KosovoKuwaitKyrgyz RepublicLao PDRLate-demographic dividendLatin America & Caribbean Latin America & Caribbean (excluding high income)Latin America & the Caribbean (IDA & IBRD countries)LatviaLeast developed countries: UN classificationLebanonLiberiaLibyaLithuaniaLow & middle incomeLow incomeLower middle incomeLuxembourgMacao SAR, ChinaMacedonia, FYRMadagascarMalawiMalaysiaMaldivesMaliMaltaMauritaniaMauritiusMexicoMiddle East & North AfricaMiddle East & North Africa (excluding high income)Middle East & North Africa (IDA & IBRD countries)Middle incomeMoldovaMongoliaMontenegroMoroccoMozambiqueMyanmarNauruNepalNetherlandsNew CaledoniaNew ZealandNicaraguaNigerNigeriaNorth AmericaNorwayOECD membersOmanOther small statesPacific island small statesPakistanPanamaPapua New GuineaParaguayPeruPhilippinesPolandPortugalPost-demographic dividendPre-demographic dividendQatarRomaniaRussian FederationRwandaSamoaSao Tome and PrincipeSaudi ArabiaSenegalSerbiaSeychellesSierra LeoneSingaporeSlovak RepublicSloveniaSmall statesSolomon IslandsSomaliaSouth AfricaSouth AsiaSouth Asia (IDA & IBRD)SpainSri LankaSt. Kitts and NevisSt. LuciaSt. Vincent and the GrenadinesSub-Saharan Africa Sub-Saharan Africa (excluding high income)Sub-Saharan Africa (IDA & IBRD countries)SudanSurinameSwedenSwitzerlandSyrian Arab RepublicTajikistanTanzaniaThailandTogoTongaTrinidad and TobagoTunisiaTurkeyTurkmenistanTuvaluUgandaUkraineUnited Arab EmiratesUnited KingdomUnited StatesUpper middle incomeUruguayUzbekistanVanuatuVenezuela, RBVietnamWorldYemen, Rep.ZambiaZimbabwe Zeitlinie:
Diese Zeitleiste vorliegt die Graphik ab 1961 J. bis 2015 J. OECD members. Die Angaben bis 1960 J. sind nicht vorhanden. Die Zahl aktueller Beobachtungen nach Daten: 55.
Die Quelle (Bezeichnung):
Kennzahlen der Weltentwicklung
Die Quelle (Einrichtung):
World Bank staff estimates based data from International Monetary Fund's Direction of Trade database.
Kategorien:
Private Sector, Trade
Es wurde aktualisiert:
23 Apr 2017 Jahr
Kennzahlen der Wertänderungen vom Jahr zum Jahr
im Durchschnitt:
3.118 Trln
Minimum:
82.029 Mlrd.
1 Jan 1961 Jahr
Maximum:
10.504 Trln
1 Jan 2015 Jahr
Zum Datum der Beobachtung
Wert
Absolute Veränderung
Die Veränderung bezüglich dem vorherigen Wert
1 Jan 1961 Jahr
82.029 Mlrd.
+82.029 Mlrd.
0.0%
1 Jan 1962 Jahr
86.849 Mlrd.
+4.819 Mlrd.
5.88%
1 Jan 1963 Jahr
90.732 Mlrd.
+3.883 Mlrd.
4.47%
1 Jan 1964 Jahr
98.922 Mlrd.
+8.191 Mlrd.
9.03%
1 Jan 1965 Jahr
111.722 Mlrd.
+12.8 Mlrd.
12.94%
1 Jan 1966 Jahr
121.784 Mlrd.
+10.062 Mlrd.
9.01%
1 Jan 1967 Jahr
135.729 Mlrd.
+13.944 Mlrd.
11.45%
1 Jan 1968 Jahr
143.109 Mlrd.
+7.381 Mlrd.
5.44%
1 Jan 1969 Jahr
162.177 Mlrd.
+19.067 Mlrd.
13.32%
1 Jan 1970 Jahr
187.051 Mlrd.
+24.874 Mlrd.
15.34%
1 Jan 1971 Jahr
219.486 Mlrd.
+32.435 Mlrd.
17.34%
1 Jan 1972 Jahr
245.882 Mlrd.
+26.396 Mlrd.
12.03%
1 Jan 1973 Jahr
292.8 Mlrd.
+46.918 Mlrd.
19.08%
1 Jan 1974 Jahr
400.342 Mlrd.
+107.542 Mlrd.
36.73%
1 Jan 1975 Jahr
534.518 Mlrd.
+134.176 Mlrd.
33.52%
1 Jan 1976 Jahr
571.407 Mlrd.
+36.889 Mlrd.
6.9%
1 Jan 1977 Jahr
636.22 Mlrd.
+64.813 Mlrd.
11.34%
1 Jan 1978 Jahr
722.457 Mlrd.
+86.236 Mlrd.
13.55%
1 Jan 1979 Jahr
866.25 Mlrd.
+143.794 Mlrd.
19.9%
1 Jan 1980 Jahr
1.065 Trln
+199.141 Mlrd.
22.99%
1 Jan 1981 Jahr
1.253 Trln
+188.108 Mlrd.
17.66%
1 Jan 1982 Jahr
1.246 Trln
-7.725 Mlrd.
-0.62%
1 Jan 1983 Jahr
1.187 Trln
-58.553 Mlrd.
-4.7%
1 Jan 1984 Jahr
1.176 Trln
-11.252 Mlrd.
-0.95%
1 Jan 1985 Jahr
1.261 Trln
+84.68 Mlrd.
7.2%
1 Jan 1986 Jahr
1.303 Trln
+42.457 Mlrd.
3.37%
1 Jan 1987 Jahr
1.494 Trln
+191.361 Mlrd.
14.68%
1 Jan 1988 Jahr
1.76 Trln
+265.727 Mlrd.
17.78%
1 Jan 1989 Jahr
2.021 Trln
+260.592 Mlrd.
14.8%
1 Jan 1990 Jahr
2.161 Trln
+140.545 Mlrd.
6.95%
1 Jan 1991 Jahr
2.477 Trln
+315.58 Mlrd.
14.6%
1 Jan 1992 Jahr
2.552 Trln
+75.589 Mlrd.
3.05%
1 Jan 1993 Jahr
2.71 Trln
+157.254 Mlrd.
6.16%
1 Jan 1994 Jahr
2.661 Trln
-48.824 Mlrd.
-1.8%
1 Jan 1995 Jahr
3.008 Trln
+347.042 Mlrd.
13.04%
1 Jan 1996 Jahr
3.589 Trln
+581.342 Mlrd.
19.33%
1 Jan 1997 Jahr
3.712 Trln
+122.937 Mlrd.
3.43%
1 Jan 1998 Jahr
4.031 Trln
+318.643 Mlrd.
8.58%
1 Jan 1999 Jahr
4.042 Trln
+10.609 Mlrd.
0.26%
1 Jan 2000 Jahr
4.215 Trln
+173.24 Mlrd.
4.29%
1 Jan 2001 Jahr
4.562 Trln
+346.899 Mlrd.
8.23%
1 Jan 2002 Jahr
4.431 Trln
-130.911 Mlrd.
-2.87%
1 Jan 2003 Jahr
4.59 Trln
+159.478 Mlrd.
3.6%
1 Jan 2004 Jahr
5.286 Trln
+696.171 Mlrd.
15.17%
1 Jan 2005 Jahr
6.291 Trln
+1.004 Trln
19.0%
1 Jan 2006 Jahr
6.908 Trln
+616.748 Mlrd.
9.8%
1 Jan 2007 Jahr
7.79 Trln
+882.478 Mlrd.
12.78%
1 Jan 2008 Jahr
8.929 Trln
+1.139 Trln
14.62%
1 Jan 2009 Jahr
9.95 Trln
+1.021 Trln
11.43%
1 Jan 2010 Jahr
7.751 Trln
-2.199 Trln
-22.1%
1 Jan 2011 Jahr
8.933 Trln
+1.182 Trln
15.25%
1 Jan 2012 Jahr
10.399 Trln
+1.466 Trln
16.41%
1 Jan 2013 Jahr
10.167 Trln
-232.642 Mlrd.
-2.24%
1 Jan 2014 Jahr
10.375 Trln
+208.225 Mlrd.
2.05%
1 Jan 2015 Jahr
10.504 Trln
+128.98 Mlrd.
1.24%
Bewertung der Länder gemäß mit laufender Statistik nach Jahren


Kommentare: