29
/de/
de
AIzaSyAYiBZKx7MnpbEhh9jyipgxe19OcubqV5w
April 1, 2024
35932
High income
HIC
false
2
1
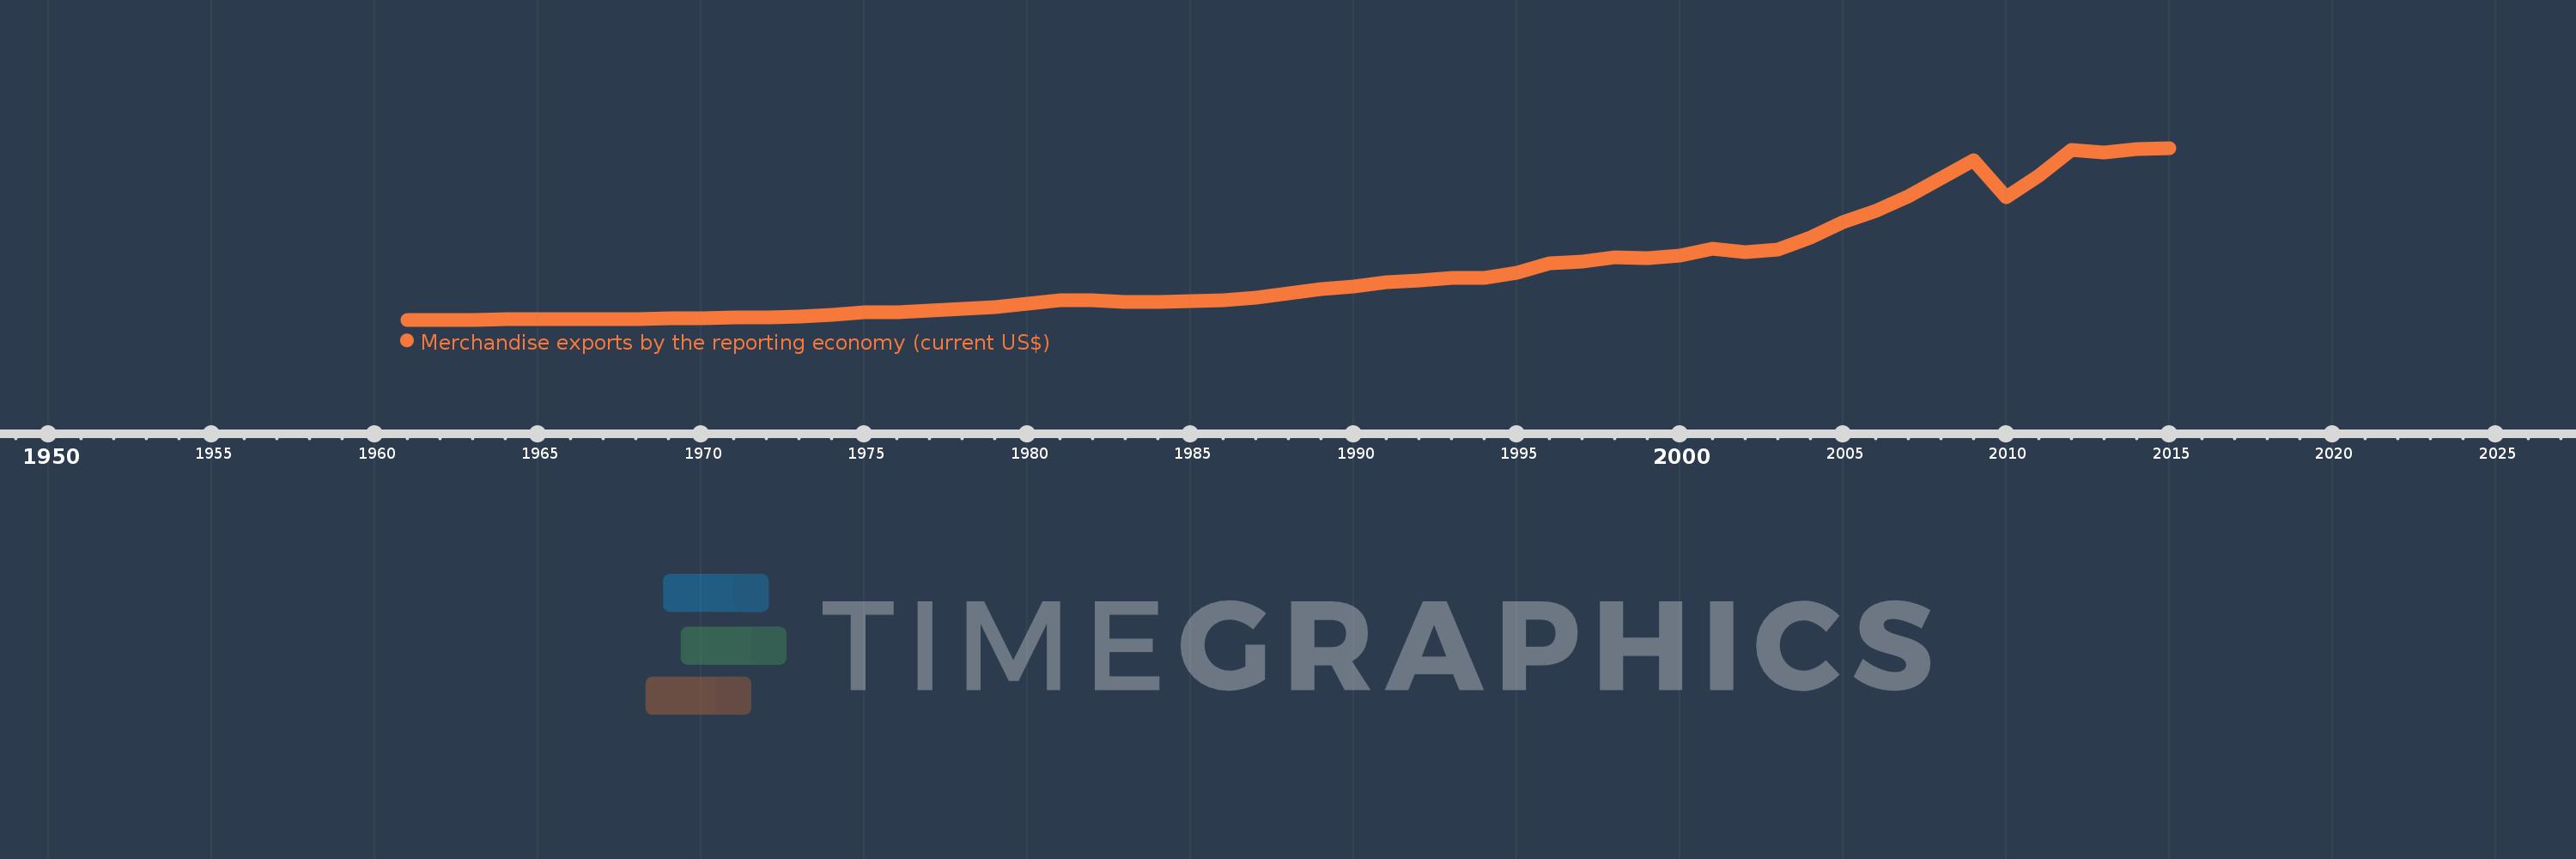
Merchandise exports by the reporting economy (current US$)
2015,2014,2013,2012,2011,2010,2009,2008,2007,2006,2005,2004,2003,2002,2001,2000,1999,1998,1997,1996,1995,1994,1993,1992,1991,1990,1989,1988,1987,1986,1985,1984,1983,1982,1981,1980,1979,1978,1977,1976,1975,1974,1973,1972,1971,1970,1969,1968,1967,1966,1965,1964,1963,1962,1961
Diese Statistik in anderen Ländern:
AfghanistanAlbaniaAlgeriaAmerican SamoaAngolaAntigua and BarbudaArab WorldArgentinaArmeniaArubaAustraliaAustriaAzerbaijanBahamas, TheBahrainBangladeshBarbadosBelarusBelgiumBelizeBeninBermudaBoliviaBosnia and HerzegovinaBrazilBrunei DarussalamBulgariaBurkina FasoBurundiCabo VerdeCambodiaCameroonCanadaCaribbean small statesCentral African RepublicCentral Europe and the BalticsChadChileChinaColombiaComorosCongo, Dem. Rep.Congo, Rep.Costa RicaCote d'IvoireCroatiaCubaCyprusCzech RepublicDenmarkDjiboutiDominicaDominican RepublicEarly-demographic dividendEast Asia & PacificEast Asia & Pacific (excluding high income)East Asia & Pacific (IDA & IBRD countries)EcuadorEgypt, Arab Rep.El SalvadorEquatorial GuineaEstoniaEthiopiaEuro areaEurope & Central AsiaEurope & Central Asia (excluding high income)Europe & Central Asia (IDA & IBRD countries)European UnionFaroe IslandsFijiFinlandFragile and conflict affected situationsFranceFrench PolynesiaGabonGambia, TheGeorgiaGermanyGhanaGibraltarGreeceGreenlandGrenadaGuamGuatemalaGuineaGuinea-BissauGuyanaHaitiHeavily indebted poor countries (HIPC)High incomeHondurasHong Kong SAR, ChinaHungaryIBRD onlyIcelandIDA & IBRD totalIDA blendIDA onlyIDA totalIndiaIndonesiaIran, Islamic Rep.IraqIrelandIsraelItalyJamaicaJapanJordanKazakhstanKenyaKiribatiKorea, Dem. People’s Rep.Korea, Rep.KosovoKuwaitKyrgyz RepublicLao PDRLate-demographic dividendLatin America & Caribbean Latin America & Caribbean (excluding high income)Latin America & the Caribbean (IDA & IBRD countries)LatviaLeast developed countries: UN classificationLebanonLiberiaLibyaLithuaniaLow & middle incomeLow incomeLower middle incomeLuxembourgMacao SAR, ChinaMacedonia, FYRMadagascarMalawiMalaysiaMaldivesMaliMaltaMauritaniaMauritiusMexicoMiddle East & North AfricaMiddle East & North Africa (excluding high income)Middle East & North Africa (IDA & IBRD countries)Middle incomeMoldovaMongoliaMontenegroMoroccoMozambiqueMyanmarNauruNepalNetherlandsNew CaledoniaNew ZealandNicaraguaNigerNigeriaNorth AmericaNorwayOECD membersOmanOther small statesPacific island small statesPakistanPanamaPapua New GuineaParaguayPeruPhilippinesPolandPortugalPost-demographic dividendPre-demographic dividendQatarRomaniaRussian FederationRwandaSamoaSao Tome and PrincipeSaudi ArabiaSenegalSerbiaSeychellesSierra LeoneSingaporeSlovak RepublicSloveniaSmall statesSolomon IslandsSomaliaSouth AfricaSouth AsiaSouth Asia (IDA & IBRD)SpainSri LankaSt. Kitts and NevisSt. LuciaSt. Vincent and the GrenadinesSub-Saharan Africa Sub-Saharan Africa (excluding high income)Sub-Saharan Africa (IDA & IBRD countries)SudanSurinameSwedenSwitzerlandSyrian Arab RepublicTajikistanTanzaniaThailandTogoTongaTrinidad and TobagoTunisiaTurkeyTurkmenistanTuvaluUgandaUkraineUnited Arab EmiratesUnited KingdomUnited StatesUpper middle incomeUruguayUzbekistanVanuatuVenezuela, RBVietnamWorldYemen, Rep.ZambiaZimbabwe Zeitlinie:
Diese Zeitleiste vorliegt die Graphik ab 1961 J. bis 2015 J. High income. Die Angaben bis 1960 J. sind nicht vorhanden. Die Zahl aktueller Beobachtungen nach Daten: 55.
Die Quelle (Bezeichnung):
Kennzahlen der Weltentwicklung
Die Quelle (Einrichtung):
World Bank staff estimates based data from International Monetary Fund's Direction of Trade database.
Kategorien:
Private Sector, Trade
Es wurde aktualisiert:
23 Apr 2017 Jahr
Kennzahlen der Wertänderungen vom Jahr zum Jahr
im Durchschnitt:
3.512 Trln
Minimum:
82.435 Mlrd.
1 Jan 1961 Jahr
Maximum:
12.147 Trln
1 Jan 2015 Jahr
Zum Datum der Beobachtung
Wert
Absolute Veränderung
Die Veränderung bezüglich dem vorherigen Wert
1 Jan 1961 Jahr
82.435 Mlrd.
+82.435 Mlrd.
0.0%
1 Jan 1962 Jahr
87.148 Mlrd.
+4.713 Mlrd.
5.72%
1 Jan 1963 Jahr
91.148 Mlrd.
+4.0 Mlrd.
4.59%
1 Jan 1964 Jahr
99.641 Mlrd.
+8.493 Mlrd.
9.32%
1 Jan 1965 Jahr
113.609 Mlrd.
+13.967 Mlrd.
14.02%
1 Jan 1966 Jahr
123.9 Mlrd.
+10.291 Mlrd.
9.06%
1 Jan 1967 Jahr
138.375 Mlrd.
+14.475 Mlrd.
11.68%
1 Jan 1968 Jahr
146.358 Mlrd.
+7.982 Mlrd.
5.77%
1 Jan 1969 Jahr
167.338 Mlrd.
+20.981 Mlrd.
14.34%
1 Jan 1970 Jahr
193.141 Mlrd.
+25.803 Mlrd.
15.42%
1 Jan 1971 Jahr
226.89 Mlrd.
+33.749 Mlrd.
17.47%
1 Jan 1972 Jahr
255.779 Mlrd.
+28.889 Mlrd.
12.73%
1 Jan 1973 Jahr
305.891 Mlrd.
+50.112 Mlrd.
19.59%
1 Jan 1974 Jahr
424.562 Mlrd.
+118.671 Mlrd.
38.8%
1 Jan 1975 Jahr
597.132 Mlrd.
+172.571 Mlrd.
40.65%
1 Jan 1976 Jahr
631.758 Mlrd.
+34.625 Mlrd.
5.8%
1 Jan 1977 Jahr
724.986 Mlrd.
+93.229 Mlrd.
14.76%
1 Jan 1978 Jahr
819.842 Mlrd.
+94.856 Mlrd.
13.08%
1 Jan 1979 Jahr
962.746 Mlrd.
+142.905 Mlrd.
17.43%
1 Jan 1980 Jahr
1.211 Trln
+247.931 Mlrd.
25.75%
1 Jan 1981 Jahr
1.467 Trln
+256.388 Mlrd.
21.18%
1 Jan 1982 Jahr
1.47 Trln
+2.655 Mlrd.
0.18%
1 Jan 1983 Jahr
1.357 Trln
-112.674 Mlrd.
-7.67%
1 Jan 1984 Jahr
1.315 Trln
-42.328 Mlrd.
-3.12%
1 Jan 1985 Jahr
1.4 Trln
+85.307 Mlrd.
6.49%
1 Jan 1986 Jahr
1.432 Trln
+32.128 Mlrd.
2.29%
1 Jan 1987 Jahr
1.626 Trln
+194.25 Mlrd.
13.56%
1 Jan 1988 Jahr
1.926 Trln
+299.696 Mlrd.
18.43%
1 Jan 1989 Jahr
2.217 Trln
+291.121 Mlrd.
15.11%
1 Jan 1990 Jahr
2.389 Trln
+172.023 Mlrd.
7.76%
1 Jan 1991 Jahr
2.737 Trln
+347.524 Mlrd.
14.55%
1 Jan 1992 Jahr
2.825 Trln
+88.238 Mlrd.
3.22%
1 Jan 1993 Jahr
3.017 Trln
+192.218 Mlrd.
6.8%
1 Jan 1994 Jahr
2.99 Trln
-26.886 Mlrd.
-0.89%
1 Jan 1995 Jahr
3.377 Trln
+386.807 Mlrd.
12.94%
1 Jan 1996 Jahr
4.016 Trln
+639.063 Mlrd.
18.92%
1 Jan 1997 Jahr
4.158 Trln
+141.831 Mlrd.
3.53%
1 Jan 1998 Jahr
4.48 Trln
+321.604 Mlrd.
7.73%
1 Jan 1999 Jahr
4.405 Trln
-74.141 Mlrd.
-1.66%
1 Jan 2000 Jahr
4.595 Trln
+189.608 Mlrd.
4.3%
1 Jan 2001 Jahr
5.047 Trln
+452.331 Mlrd.
9.84%
1 Jan 2002 Jahr
4.858 Trln
-189.521 Mlrd.
-3.75%
1 Jan 2003 Jahr
5.03 Trln
+171.919 Mlrd.
3.54%
1 Jan 2004 Jahr
5.831 Trln
+801.55 Mlrd.
15.94%
1 Jan 2005 Jahr
6.971 Trln
+1.139 Trln
19.54%
1 Jan 2006 Jahr
7.74 Trln
+769.752 Mlrd.
11.04%
1 Jan 2007 Jahr
8.768 Trln
+1.027 Trln
13.27%
1 Jan 2008 Jahr
10.006 Trln
+1.238 Trln
14.12%
1 Jan 2009 Jahr
11.286 Trln
+1.28 Trln
12.8%
1 Jan 2010 Jahr
8.715 Trln
-2.571 Trln
-22.78%
1 Jan 2011 Jahr
10.223 Trln
+1.508 Trln
17.3%
1 Jan 2012 Jahr
12.009 Trln
+1.786 Trln
17.47%
1 Jan 2013 Jahr
11.842 Trln
-166.682 Mlrd.
-1.39%
1 Jan 2014 Jahr
12.063 Trln
+220.908 Mlrd.
1.87%
1 Jan 2015 Jahr
12.147 Trln
+84.081 Mlrd.
0.7%
Bewertung der Länder gemäß mit laufender Statistik nach Jahren


Kommentare: