29
/de/
de
AIzaSyAYiBZKx7MnpbEhh9jyipgxe19OcubqV5w
April 1, 2024
48378
Middle East & North Africa
MEA
false
2
1
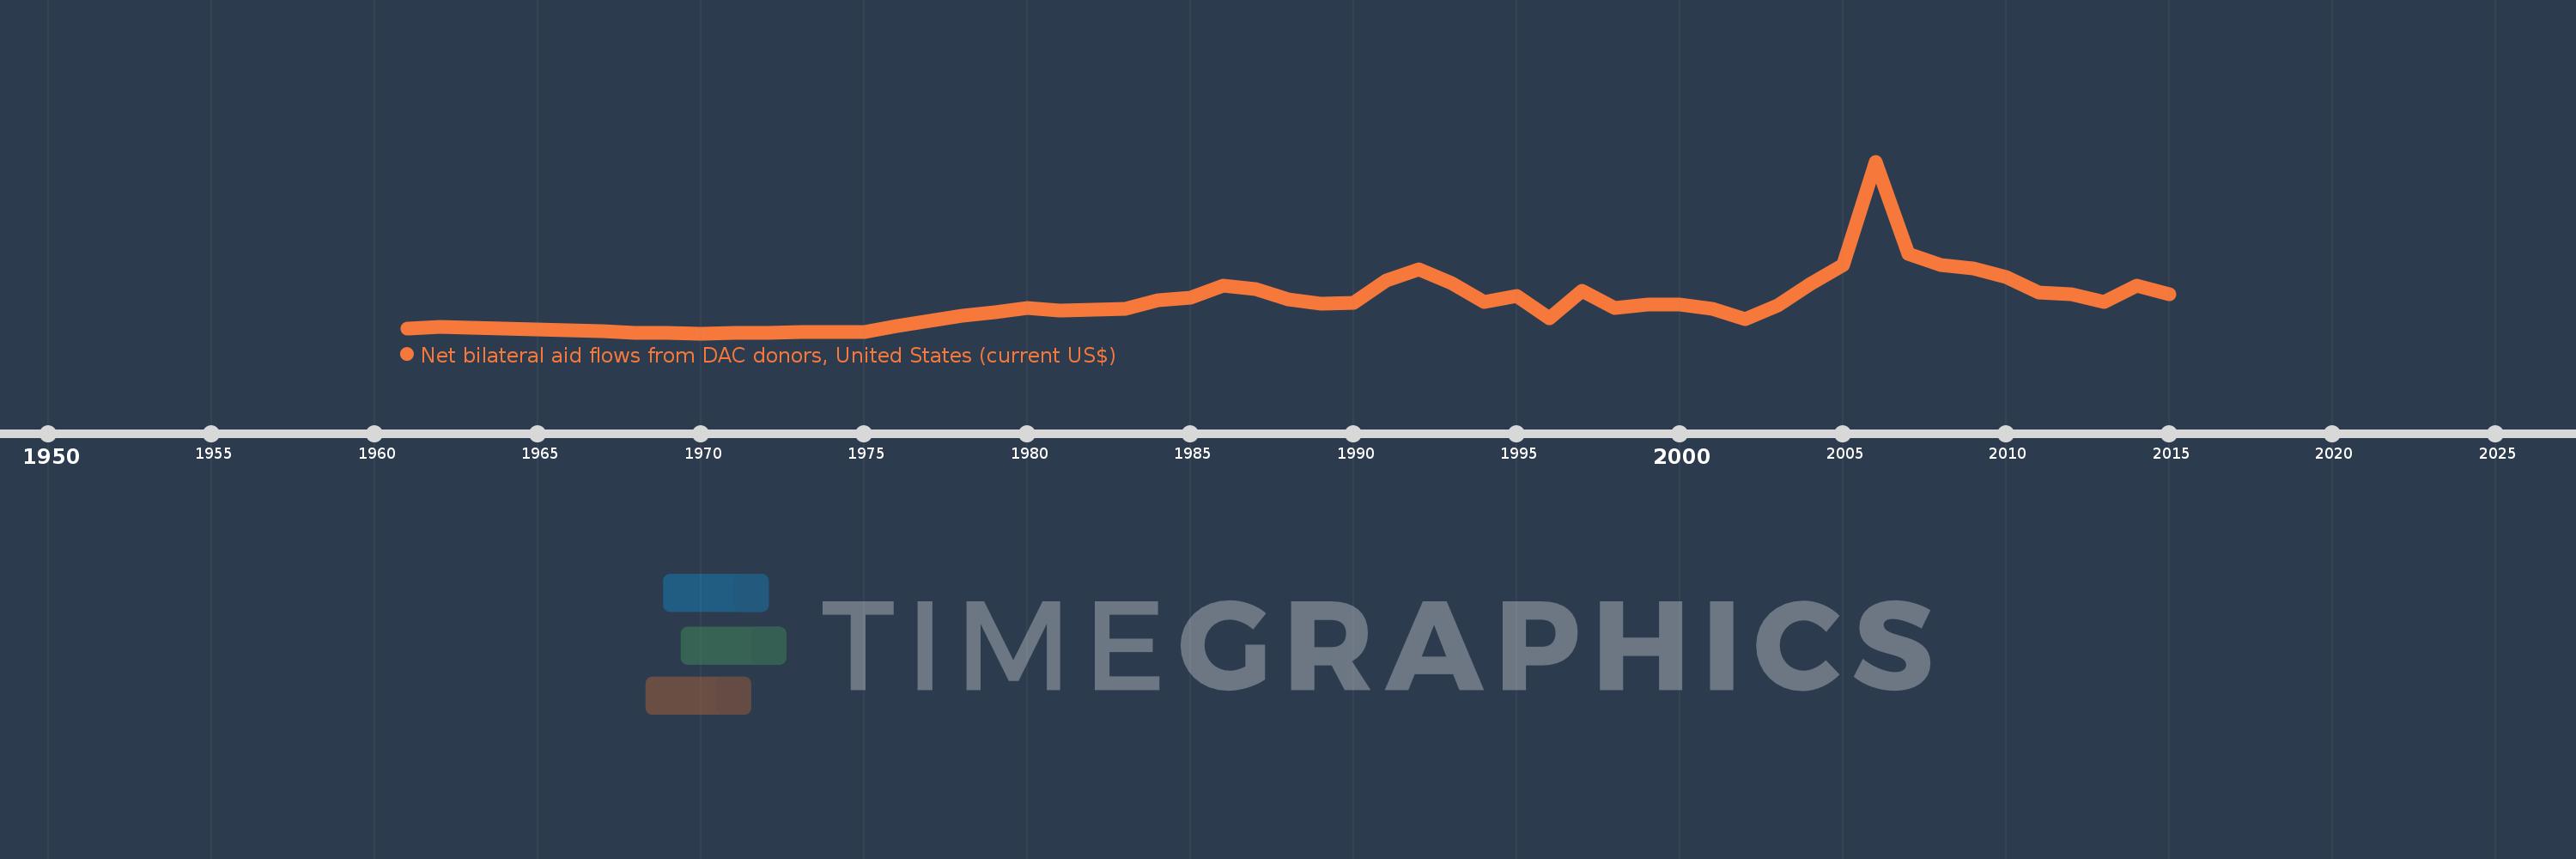
Net bilateral aid flows from DAC donors, United States (current US$)
2015,2014,2013,2012,2011,2010,2009,2008,2007,2006,2005,2004,2003,2002,2001,2000,1999,1998,1997,1996,1995,1994,1993,1992,1991,1990,1989,1988,1987,1986,1985,1984,1983,1982,1981,1980,1979,1978,1977,1976,1975,1974,1973,1972,1971,1970,1969,1968,1967,1966,1965,1964,1963,1962,1961
Diese Statistik in anderen Ländern:
AfghanistanAlbaniaAlgeriaAngolaAntigua and BarbudaArab WorldArgentinaArmeniaArubaAzerbaijanBahamas, TheBahrainBangladeshBarbadosBelarusBelizeBeninBermudaBhutanBoliviaBosnia and HerzegovinaBotswanaBrazilBritish Virgin IslandsBulgariaBurkina FasoBurundiCabo VerdeCambodiaCameroonCaribbean small statesCayman IslandsCentral African RepublicCentral Europe and the BalticsChadChileChinaColombiaComorosCongo, Dem. Rep.Congo, Rep.Costa RicaCote d'IvoireCroatiaCubaCyprusCzech RepublicDjiboutiDominicaDominican RepublicEast Asia & PacificEast Asia & Pacific (excluding high income)East Asia & Pacific (IDA & IBRD countries)EcuadorEgypt, Arab Rep.El SalvadorEquatorial GuineaEritreaEstoniaEthiopiaEuro areaEurope & Central AsiaEurope & Central Asia (excluding high income)Europe & Central Asia (IDA & IBRD countries)European UnionFijiFragile and conflict affected situationsGabonGambia, TheGeorgiaGhanaGrenadaGuatemalaGuineaGuinea-BissauGuyanaHaitiHeavily indebted poor countries (HIPC)High incomeHondurasHong Kong SAR, ChinaHungaryIBRD onlyIDA & IBRD totalIDA blendIDA onlyIDA totalIndiaIndonesiaIran, Islamic Rep.IraqIsraelJamaicaJordanKazakhstanKenyaKiribatiKorea, Dem. People’s Rep.Korea, Rep.KosovoKyrgyz RepublicLao PDRLatin America & Caribbean Latin America & Caribbean (excluding high income)Latin America & the Caribbean (IDA & IBRD countries)LatviaLeast developed countries: UN classificationLebanonLesothoLiberiaLibyaLithuaniaLow & middle incomeLow incomeLower middle incomeMacao SAR, ChinaMacedonia, FYRMadagascarMalawiMalaysiaMaldivesMaliMaltaMarshall IslandsMauritaniaMauritiusMexicoMicronesia, Fed. Sts.Middle East & North AfricaMiddle East & North Africa (excluding high income)Middle East & North Africa (IDA & IBRD countries)Middle incomeMoldovaMongoliaMontenegroMoroccoMozambiqueMyanmarNamibiaNepalNicaraguaNigerNigeriaNorth AmericaNorthern Mariana IslandsOECD membersOmanOther small statesPacific island small statesPakistanPalauPanamaPapua New GuineaParaguayPeruPhilippinesPolandQatarRomaniaRussian FederationRwandaSamoaSao Tome and PrincipeSaudi ArabiaSenegalSerbiaSeychellesSierra LeoneSingaporeSlovak RepublicSloveniaSmall statesSolomon IslandsSomaliaSouth AfricaSouth AsiaSouth Asia (IDA & IBRD)South SudanSri LankaSt. Kitts and NevisSt. LuciaSt. Vincent and the GrenadinesSub-Saharan Africa Sub-Saharan Africa (excluding high income)Sub-Saharan Africa (IDA & IBRD countries)SudanSurinameSwazilandSyrian Arab RepublicTajikistanTanzaniaThailandTimor-LesteTogoTongaTrinidad and TobagoTunisiaTurkeyTurkmenistanTurks and Caicos IslandsTuvaluUgandaUkraineUnited Arab EmiratesUpper middle incomeUruguayUzbekistanVanuatuVenezuela, RBVietnamWest Bank and GazaWorldYemen, Rep.ZambiaZimbabwe Zeitlinie:
Diese Zeitleiste vorliegt die Graphik ab 1961 J. bis 2015 J. Middle East & North Africa. Die Angaben bis 1960 J. sind nicht vorhanden. Die Zahl aktueller Beobachtungen nach Daten: 55.
Die Quelle (Bezeichnung):
Kennzahlen der Weltentwicklung
Die Quelle (Einrichtung):
Development Assistance Committee of the Organisation for Economic Co-operation and Development, Geographical Distribution of Financial Flows to Developing Countries, Development Co-operation Report, and International Development Statistics database. Data are available online at: www.oecd.org/dac/stats/idsonline.
Kategorien:
Aid Effectiveness
Es wurde aktualisiert:
23 Apr 2017 Jahr
Kennzahlen der Wertänderungen vom Jahr zum Jahr
im Durchschnitt:
2.23 Mlrd.
Minimum:
106.0 Mln.
1 Jan 1970 Jahr
Maximum:
12.317 Mlrd.
1 Jan 2006 Jahr
Zum Datum der Beobachtung
Wert
Absolute Veränderung
Die Veränderung bezüglich dem vorherigen Wert
1 Jan 1961 Jahr
433.0 Mln.
+433.0 Mln.
0.0%
1 Jan 1962 Jahr
578.0 Mln.
+145.0 Mln.
33.49%
1 Jan 1963 Jahr
495.0 Mln.
-83.0 Mln.
-14.36%
1 Jan 1964 Jahr
444.0 Mln.
-51.0 Mln.
-10.3%
1 Jan 1965 Jahr
403.0 Mln.
-41.0 Mln.
-9.23%
1 Jan 1966 Jahr
301.37 Mln.
-101.63 Mln.
-25.22%
1 Jan 1967 Jahr
256.6 Mln.
-44.77 Mln.
-14.86%
1 Jan 1968 Jahr
133.81 Mln.
-122.79 Mln.
-47.85%
1 Jan 1969 Jahr
125.17 Mln.
-8.64 Mln.
-6.46%
1 Jan 1970 Jahr
106.0 Mln.
-19.17 Mln.
-15.32%
1 Jan 1971 Jahr
114.0 Mln.
+8.0 Mln.
7.55%
1 Jan 1972 Jahr
148.0 Mln.
+34.0 Mln.
29.82%
1 Jan 1973 Jahr
184.0 Mln.
+36.0 Mln.
24.32%
1 Jan 1974 Jahr
220.0 Mln.
+36.0 Mln.
19.57%
1 Jan 1975 Jahr
186.0 Mln.
-34.0 Mln.
-15.45%
1 Jan 1976 Jahr
616.0 Mln.
+430.0 Mln.
231.18%
1 Jan 1977 Jahr
973.0 Mln.
+357.0 Mln.
57.95%
1 Jan 1978 Jahr
1.356 Mlrd.
+383.0 Mln.
39.36%
1 Jan 1979 Jahr
1.62 Mlrd.
+264.0 Mln.
19.47%
1 Jan 1980 Jahr
1.932 Mlrd.
+312.0 Mln.
19.26%
1 Jan 1981 Jahr
1.732 Mlrd.
-200.0 Mln.
-10.35%
1 Jan 1982 Jahr
1.794 Mlrd.
+62.0 Mln.
3.58%
1 Jan 1983 Jahr
1.835 Mlrd.
+41.0 Mln.
2.29%
1 Jan 1984 Jahr
2.449 Mlrd.
+614.0 Mln.
33.46%
1 Jan 1985 Jahr
2.63 Mlrd.
+181.0 Mln.
7.39%
1 Jan 1986 Jahr
3.505 Mlrd.
+875.0 Mln.
33.27%
1 Jan 1987 Jahr
3.228 Mlrd.
-277.0 Mln.
-7.9%
1 Jan 1988 Jahr
2.544 Mlrd.
-684.0 Mln.
-21.19%
1 Jan 1989 Jahr
2.221 Mlrd.
-323.0 Mln.
-12.7%
1 Jan 1990 Jahr
2.297 Mlrd.
+76.0 Mln.
3.42%
1 Jan 1991 Jahr
3.852 Mlrd.
+1.555 Mlrd.
67.7%
1 Jan 1992 Jahr
4.661 Mlrd.
+809.0 Mln.
21.0%
1 Jan 1993 Jahr
3.696 Mlrd.
-965.0 Mln.
-20.7%
1 Jan 1994 Jahr
2.315 Mlrd.
-1.381 Mlrd.
-37.36%
1 Jan 1995 Jahr
2.746 Mlrd.
+431.0 Mln.
18.62%
1 Jan 1996 Jahr
1.166 Mlrd.
-1.58 Mlrd.
-57.54%
1 Jan 1997 Jahr
3.126 Mlrd.
+1.96 Mlrd.
168.1%
1 Jan 1998 Jahr
1.905 Mlrd.
-1.221 Mlrd.
-39.06%
1 Jan 1999 Jahr
2.159 Mlrd.
+253.73 Mln.
13.32%
1 Jan 2000 Jahr
2.121 Mlrd.
-37.34 Mln.
-1.73%
1 Jan 2001 Jahr
1.847 Mlrd.
-274.86 Mln.
-12.96%
1 Jan 2002 Jahr
1.111 Mlrd.
-735.56 Mln.
-39.83%
1 Jan 2003 Jahr
2.098 Mlrd.
+986.71 Mln.
88.82%
1 Jan 2004 Jahr
3.646 Mlrd.
+1.549 Mlrd.
73.83%
1 Jan 2005 Jahr
4.94 Mlrd.
+1.293 Mlrd.
35.46%
1 Jan 2006 Jahr
12.317 Mlrd.
+7.377 Mlrd.
149.35%
1 Jan 2007 Jahr
5.741 Mlrd.
-6.575 Mlrd.
-53.38%
1 Jan 2008 Jahr
4.965 Mlrd.
-775.97 Mln.
-13.52%
1 Jan 2009 Jahr
4.703 Mlrd.
-262.29 Mln.
-5.28%
1 Jan 2010 Jahr
4.088 Mlrd.
-615.41 Mln.
-13.08%
1 Jan 2011 Jahr
2.982 Mlrd.
-1.106 Mlrd.
-27.05%
1 Jan 2012 Jahr
2.869 Mlrd.
-113.04 Mln.
-3.79%
1 Jan 2013 Jahr
2.349 Mlrd.
-520.1 Mln.
-18.13%
1 Jan 2014 Jahr
3.509 Mlrd.
+1.16 Mlrd.
49.41%
1 Jan 2015 Jahr
2.9 Mlrd.
-608.89 Mln.
-17.35%
Bewertung der Länder gemäß mit laufender Statistik nach Jahren


Kommentare: