29
/de/
de
AIzaSyAYiBZKx7MnpbEhh9jyipgxe19OcubqV5w
April 1, 2024
43707
Latin America & the Caribbean (IDA & IBRD countries)
TLA
false
2
1
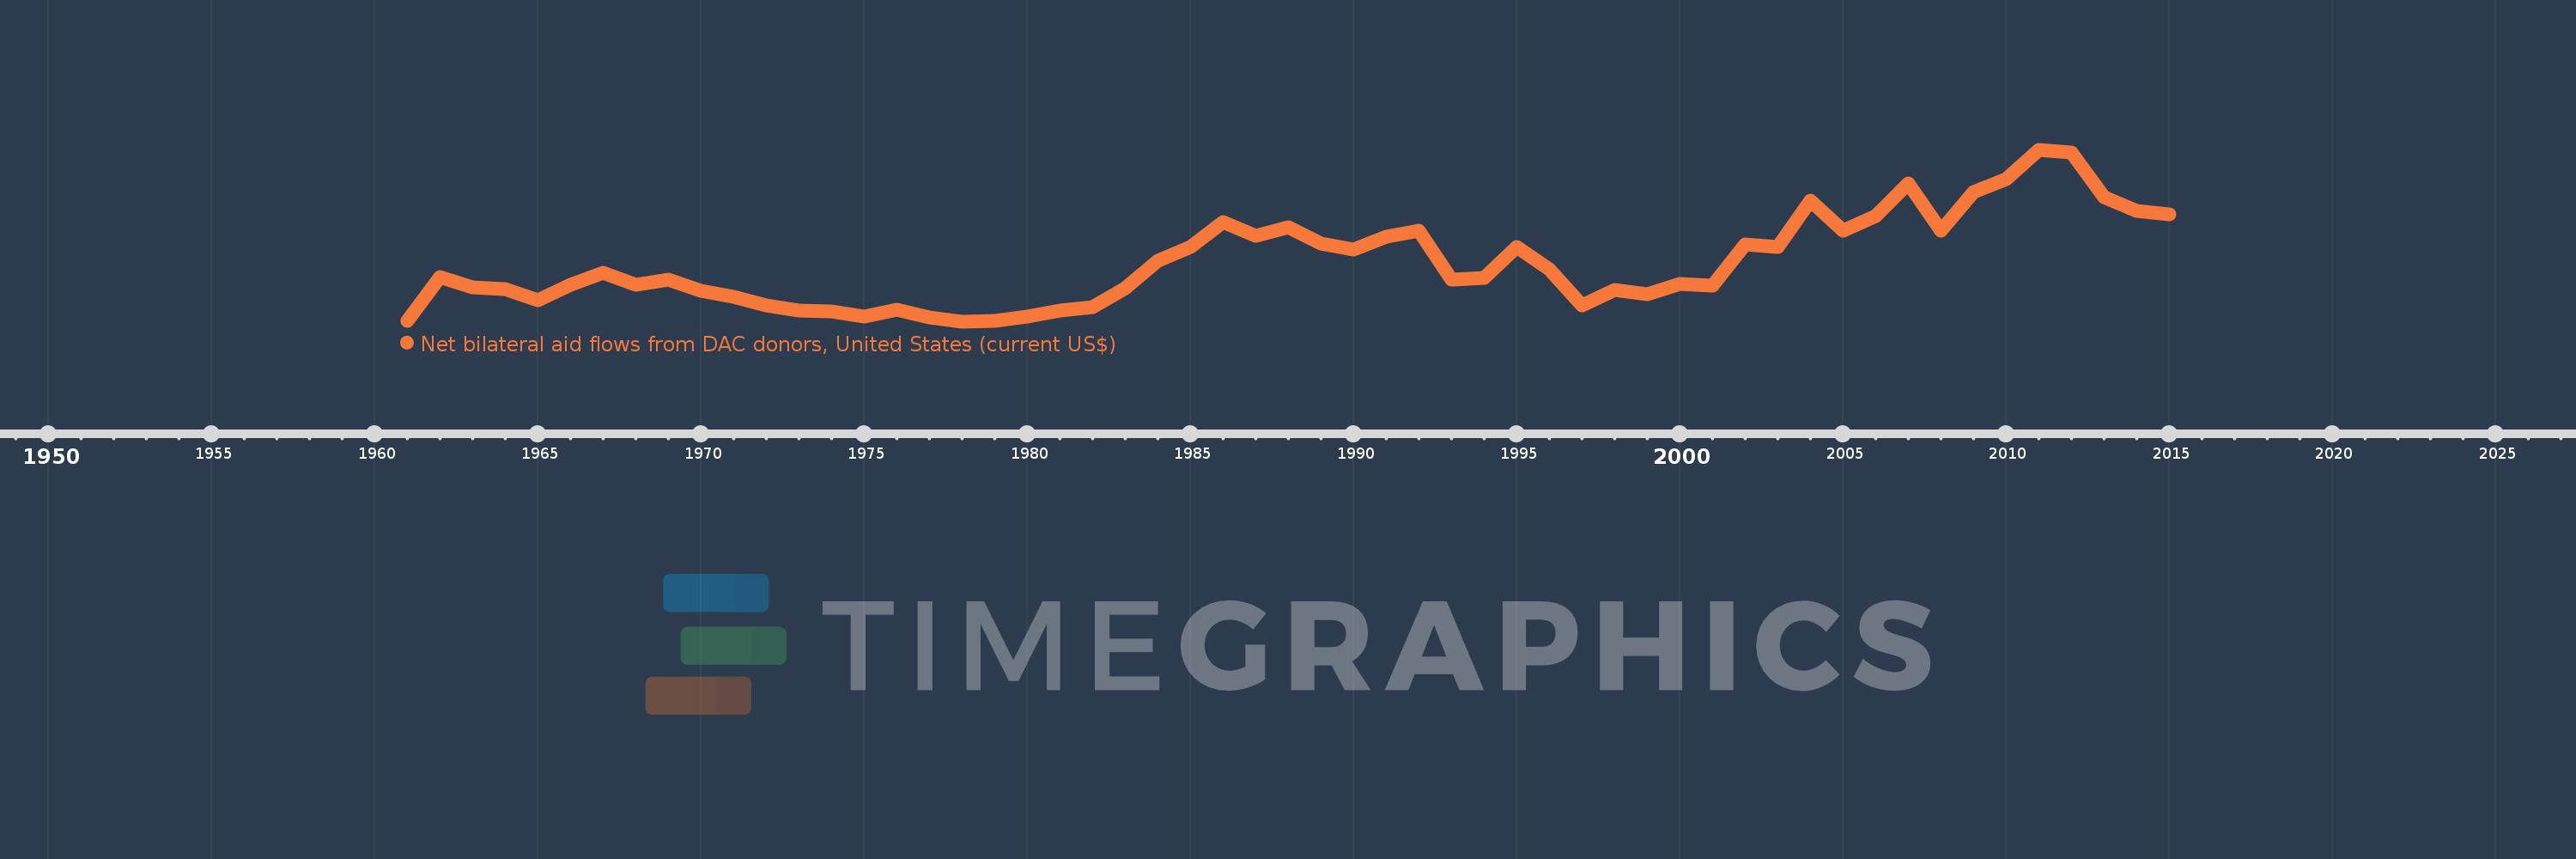
Net bilateral aid flows from DAC donors, United States (current US$)
2015,2014,2013,2012,2011,2010,2009,2008,2007,2006,2005,2004,2003,2002,2001,2000,1999,1998,1997,1996,1995,1994,1993,1992,1991,1990,1989,1988,1987,1986,1985,1984,1983,1982,1981,1980,1979,1978,1977,1976,1975,1974,1973,1972,1971,1970,1969,1968,1967,1966,1965,1964,1963,1962,1961
Diese Statistik in anderen Ländern:
AfghanistanAlbaniaAlgeriaAngolaAntigua and BarbudaArab WorldArgentinaArmeniaArubaAzerbaijanBahamas, TheBahrainBangladeshBarbadosBelarusBelizeBeninBermudaBhutanBoliviaBosnia and HerzegovinaBotswanaBrazilBritish Virgin IslandsBulgariaBurkina FasoBurundiCabo VerdeCambodiaCameroonCaribbean small statesCayman IslandsCentral African RepublicCentral Europe and the BalticsChadChileChinaColombiaComorosCongo, Dem. Rep.Congo, Rep.Costa RicaCote d'IvoireCroatiaCubaCyprusCzech RepublicDjiboutiDominicaDominican RepublicEast Asia & PacificEast Asia & Pacific (excluding high income)East Asia & Pacific (IDA & IBRD countries)EcuadorEgypt, Arab Rep.El SalvadorEquatorial GuineaEritreaEstoniaEthiopiaEuro areaEurope & Central AsiaEurope & Central Asia (excluding high income)Europe & Central Asia (IDA & IBRD countries)European UnionFijiFragile and conflict affected situationsGabonGambia, TheGeorgiaGhanaGrenadaGuatemalaGuineaGuinea-BissauGuyanaHaitiHeavily indebted poor countries (HIPC)High incomeHondurasHong Kong SAR, ChinaHungaryIBRD onlyIDA & IBRD totalIDA blendIDA onlyIDA totalIndiaIndonesiaIran, Islamic Rep.IraqIsraelJamaicaJordanKazakhstanKenyaKiribatiKorea, Dem. People’s Rep.Korea, Rep.KosovoKyrgyz RepublicLao PDRLatin America & Caribbean Latin America & Caribbean (excluding high income)Latin America & the Caribbean (IDA & IBRD countries)LatviaLeast developed countries: UN classificationLebanonLesothoLiberiaLibyaLithuaniaLow & middle incomeLow incomeLower middle incomeMacao SAR, ChinaMacedonia, FYRMadagascarMalawiMalaysiaMaldivesMaliMaltaMarshall IslandsMauritaniaMauritiusMexicoMicronesia, Fed. Sts.Middle East & North AfricaMiddle East & North Africa (excluding high income)Middle East & North Africa (IDA & IBRD countries)Middle incomeMoldovaMongoliaMontenegroMoroccoMozambiqueMyanmarNamibiaNepalNicaraguaNigerNigeriaNorth AmericaNorthern Mariana IslandsOECD membersOmanOther small statesPacific island small statesPakistanPalauPanamaPapua New GuineaParaguayPeruPhilippinesPolandQatarRomaniaRussian FederationRwandaSamoaSao Tome and PrincipeSaudi ArabiaSenegalSerbiaSeychellesSierra LeoneSingaporeSlovak RepublicSloveniaSmall statesSolomon IslandsSomaliaSouth AfricaSouth AsiaSouth Asia (IDA & IBRD)South SudanSri LankaSt. Kitts and NevisSt. LuciaSt. Vincent and the GrenadinesSub-Saharan Africa Sub-Saharan Africa (excluding high income)Sub-Saharan Africa (IDA & IBRD countries)SudanSurinameSwazilandSyrian Arab RepublicTajikistanTanzaniaThailandTimor-LesteTogoTongaTrinidad and TobagoTunisiaTurkeyTurkmenistanTurks and Caicos IslandsTuvaluUgandaUkraineUnited Arab EmiratesUpper middle incomeUruguayUzbekistanVanuatuVenezuela, RBVietnamWest Bank and GazaWorldYemen, Rep.ZambiaZimbabwe Zeitlinie:
Diese Zeitleiste vorliegt die Graphik ab 1961 J. bis 2015 J. Latin America & the Caribbean (IDA & IBRD countries). Die Angaben bis 1960 J. sind nicht vorhanden. Die Zahl aktueller Beobachtungen nach Daten: 55.
Die Quelle (Bezeichnung):
Kennzahlen der Weltentwicklung
Die Quelle (Einrichtung):
Development Assistance Committee of the Organisation for Economic Co-operation and Development, Geographical Distribution of Financial Flows to Developing Countries, Development Co-operation Report, and International Development Statistics database. Data are available online at: www.oecd.org/dac/stats/idsonline.
Kategorien:
Aid Effectiveness
Es wurde aktualisiert:
23 Apr 2017 Jahr
Kennzahlen der Wertänderungen vom Jahr zum Jahr
im Durchschnitt:
861.089 Mln.
Minimum:
164.0 Mln.
1 Jan 1978 Jahr
Maximum:
2.19 Mlrd.
1 Jan 2011 Jahr
Zum Datum der Beobachtung
Wert
Absolute Veränderung
Die Veränderung bezüglich dem vorherigen Wert
1 Jan 1961 Jahr
180.0 Mln.
+180.0 Mln.
0.0%
1 Jan 1962 Jahr
694.0 Mln.
+514.0 Mln.
285.56%
1 Jan 1963 Jahr
569.0 Mln.
-125.0 Mln.
-18.01%
1 Jan 1964 Jahr
549.0 Mln.
-20.0 Mln.
-3.51%
1 Jan 1965 Jahr
418.0 Mln.
-131.0 Mln.
-23.86%
1 Jan 1966 Jahr
606.42 Mln.
+188.42 Mln.
45.08%
1 Jan 1967 Jahr
739.6 Mln.
+133.18 Mln.
21.96%
1 Jan 1968 Jahr
601.31 Mln.
-138.29 Mln.
-18.7%
1 Jan 1969 Jahr
662.7 Mln.
+61.39 Mln.
10.21%
1 Jan 1970 Jahr
531.0 Mln.
-131.7 Mln.
-19.87%
1 Jan 1971 Jahr
464.0 Mln.
-67.0 Mln.
-12.62%
1 Jan 1972 Jahr
359.0 Mln.
-105.0 Mln.
-22.63%
1 Jan 1973 Jahr
299.0 Mln.
-60.0 Mln.
-16.71%
1 Jan 1974 Jahr
293.0 Mln.
-6.0 Mln.
-2.01%
1 Jan 1975 Jahr
228.0 Mln.
-65.0 Mln.
-22.18%
1 Jan 1976 Jahr
305.0 Mln.
+77.0 Mln.
33.77%
1 Jan 1977 Jahr
214.0 Mln.
-91.0 Mln.
-29.84%
1 Jan 1978 Jahr
164.0 Mln.
-50.0 Mln.
-23.36%
1 Jan 1979 Jahr
177.0 Mln.
+13.0 Mln.
7.93%
1 Jan 1980 Jahr
230.0 Mln.
+53.0 Mln.
29.94%
1 Jan 1981 Jahr
302.0 Mln.
+72.0 Mln.
31.3%
1 Jan 1982 Jahr
344.0 Mln.
+42.0 Mln.
13.91%
1 Jan 1983 Jahr
565.0 Mln.
+221.0 Mln.
64.24%
1 Jan 1984 Jahr
883.0 Mln.
+318.0 Mln.
56.28%
1 Jan 1985 Jahr
1.045 Mlrd.
+162.0 Mln.
18.35%
1 Jan 1986 Jahr
1.343 Mlrd.
+298.0 Mln.
28.52%
1 Jan 1987 Jahr
1.184 Mlrd.
-159.0 Mln.
-11.84%
1 Jan 1988 Jahr
1.281 Mlrd.
+97.0 Mln.
8.19%
1 Jan 1989 Jahr
1.086 Mlrd.
-195.0 Mln.
-15.22%
1 Jan 1990 Jahr
1.016 Mlrd.
-70.0 Mln.
-6.45%
1 Jan 1991 Jahr
1.168 Mlrd.
+152.0 Mln.
14.96%
1 Jan 1992 Jahr
1.241 Mlrd.
+73.0 Mln.
6.25%
1 Jan 1993 Jahr
660.0 Mln.
-581.0 Mln.
-46.82%
1 Jan 1994 Jahr
679.0 Mln.
+19.0 Mln.
2.88%
1 Jan 1995 Jahr
1.044 Mlrd.
+365.0 Mln.
53.76%
1 Jan 1996 Jahr
781.0 Mln.
-263.0 Mln.
-25.19%
1 Jan 1997 Jahr
355.0 Mln.
-426.0 Mln.
-54.55%
1 Jan 1998 Jahr
541.0 Mln.
+186.0 Mln.
52.39%
1 Jan 1999 Jahr
492.92 Mln.
-48.08 Mln.
-8.89%
1 Jan 2000 Jahr
609.03 Mln.
+116.11 Mln.
23.56%
1 Jan 2001 Jahr
593.19 Mln.
-15.84 Mln.
-2.6%
1 Jan 2002 Jahr
1.079 Mlrd.
+485.31 Mln.
81.81%
1 Jan 2003 Jahr
1.047 Mlrd.
-31.44 Mln.
-2.92%
1 Jan 2004 Jahr
1.596 Mlrd.
+549.08 Mln.
52.44%
1 Jan 2005 Jahr
1.239 Mlrd.
-356.68 Mln.
-22.35%
1 Jan 2006 Jahr
1.411 Mlrd.
+171.1 Mln.
13.8%
1 Jan 2007 Jahr
1.795 Mlrd.
+384.51 Mln.
27.26%
1 Jan 2008 Jahr
1.245 Mlrd.
-550.23 Mln.
-30.65%
1 Jan 2009 Jahr
1.699 Mlrd.
+454.22 Mln.
36.49%
1 Jan 2010 Jahr
1.852 Mlrd.
+153.39 Mln.
9.03%
1 Jan 2011 Jahr
2.19 Mlrd.
+337.25 Mln.
18.21%
1 Jan 2012 Jahr
2.165 Mlrd.
-24.94 Mln.
-1.14%
1 Jan 2013 Jahr
1.64 Mlrd.
-525.14 Mln.
-24.26%
1 Jan 2014 Jahr
1.477 Mlrd.
-162.58 Mln.
-9.92%
1 Jan 2015 Jahr
1.428 Mlrd.
-48.58 Mln.
-3.29%
Bewertung der Länder gemäß mit laufender Statistik nach Jahren


Kommentare: