29
/de/
de
AIzaSyAYiBZKx7MnpbEhh9jyipgxe19OcubqV5w
April 1, 2024
45928
Low income
LIC
false
2
1
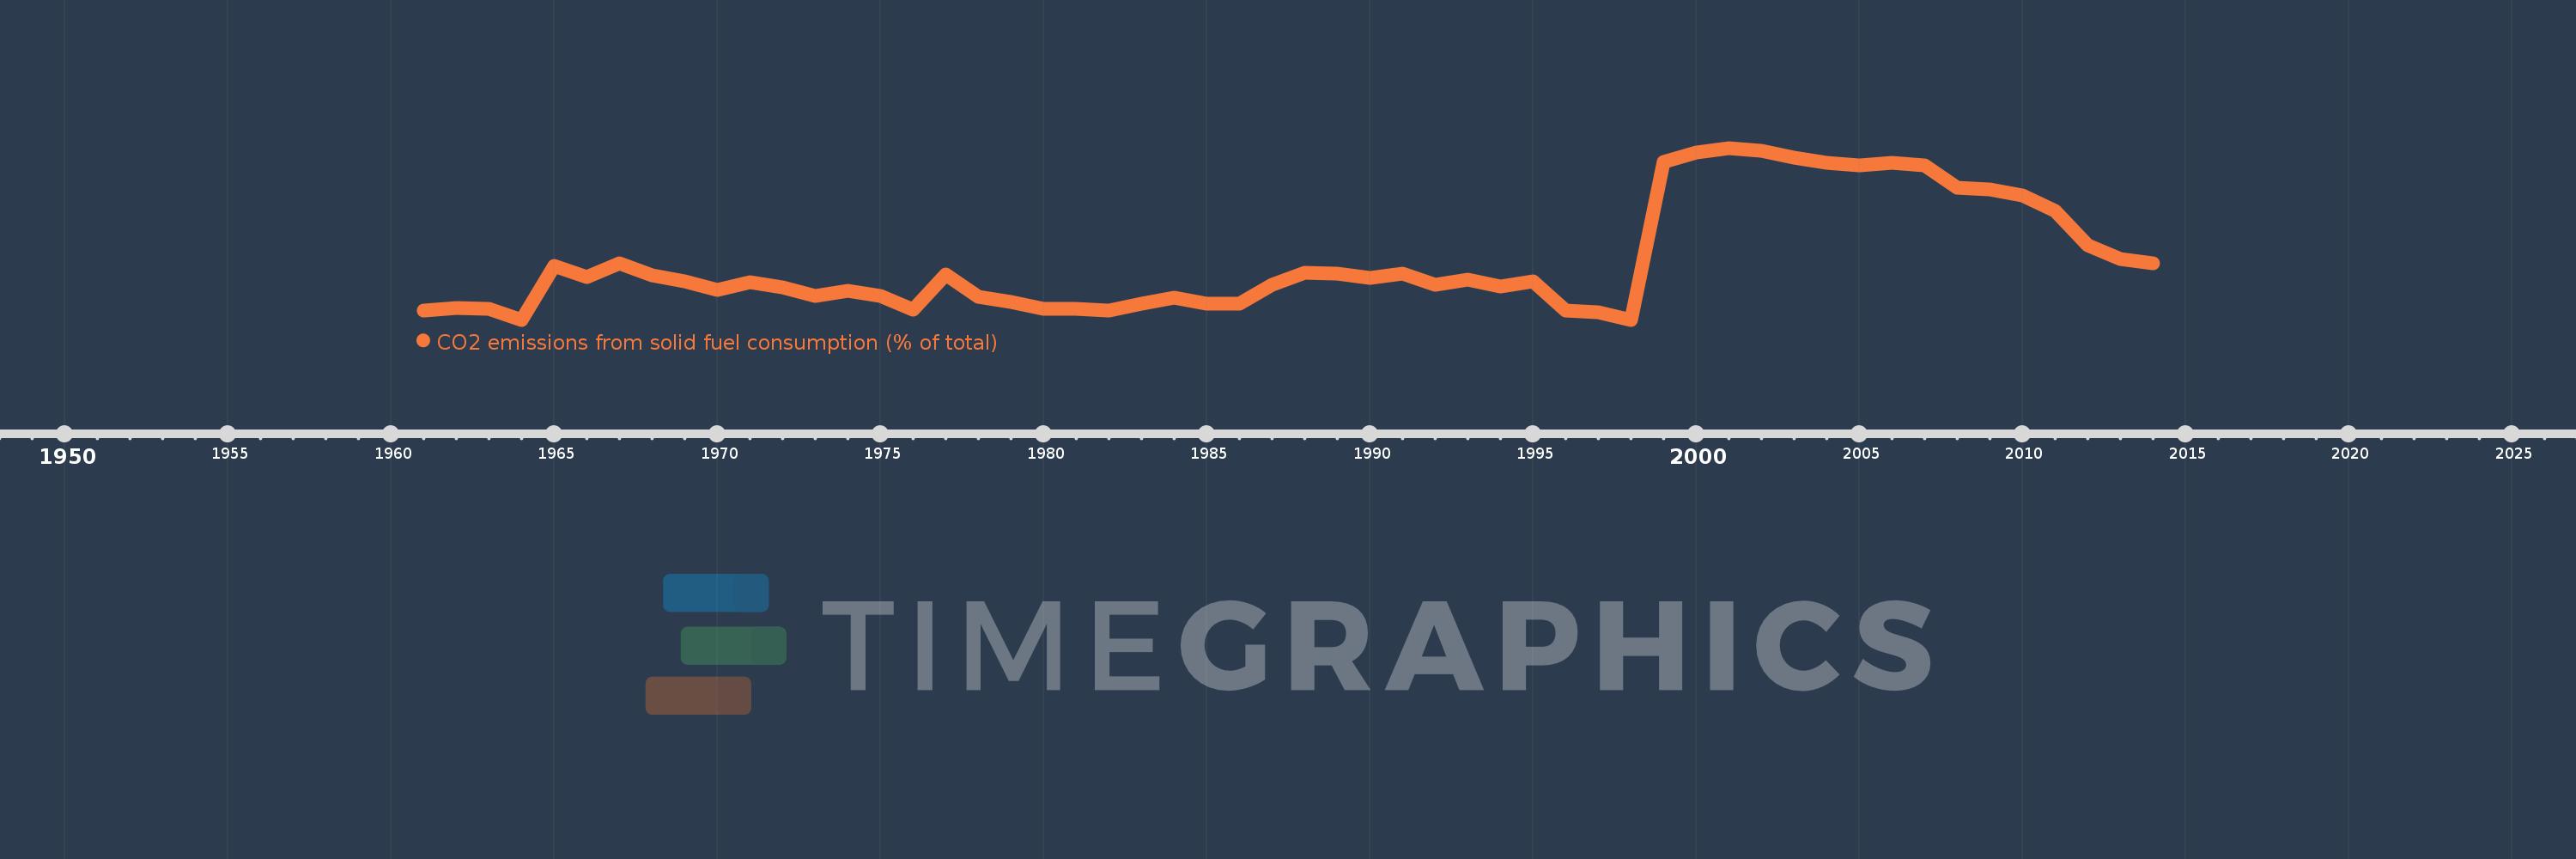
CO2 emissions from solid fuel consumption (% of total)
2014,2013,2012,2011,2010,2009,2008,2007,2006,2005,2004,2003,2002,2001,2000,1999,1998,1997,1996,1995,1994,1993,1992,1991,1990,1989,1988,1987,1986,1985,1984,1983,1982,1981,1980,1979,1978,1977,1976,1975,1974,1973,1972,1971,1970,1969,1968,1967,1966,1965,1964,1963,1962,1961
Diese Statistik in anderen Ländern:
AfghanistanAlbaniaAlgeriaAndorraAngolaAntigua and BarbudaArab WorldArgentinaArmeniaArubaAustraliaAustriaAzerbaijanBahamas, TheBahrainBangladeshBarbadosBelarusBelgiumBelizeBeninBermudaBhutanBoliviaBosnia and HerzegovinaBotswanaBrazilBritish Virgin IslandsBrunei DarussalamBulgariaBurkina FasoBurundiCabo VerdeCambodiaCameroonCanadaCaribbean small statesCayman IslandsCentral African RepublicCentral Europe and the BalticsChadChileChinaColombiaComorosCongo, Dem. Rep.Congo, Rep.Costa RicaCote d'IvoireCroatiaCubaCuracaoCyprusCzech RepublicDenmarkDjiboutiDominicaDominican RepublicEarly-demographic dividendEast Asia & PacificEast Asia & Pacific (excluding high income)East Asia & Pacific (IDA & IBRD countries)EcuadorEgypt, Arab Rep.El SalvadorEquatorial GuineaEritreaEstoniaEthiopiaEuro areaEurope & Central AsiaEurope & Central Asia (excluding high income)Europe & Central Asia (IDA & IBRD countries)European UnionFaroe IslandsFijiFinlandFragile and conflict affected situationsFranceFrench PolynesiaGabonGambia, TheGeorgiaGermanyGhanaGibraltarGreeceGreenlandGrenadaGuatemalaGuineaGuinea-BissauGuyanaHaitiHeavily indebted poor countries (HIPC)High incomeHondurasHong Kong SAR, ChinaHungaryIBRD onlyIcelandIDA & IBRD totalIDA blendIDA onlyIDA totalIndiaIndonesiaIran, Islamic Rep.IraqIrelandIsraelItalyJamaicaJapanJordanKazakhstanKenyaKiribatiKorea, Dem. People’s Rep.Korea, Rep.KuwaitKyrgyz RepublicLao PDRLate-demographic dividendLatin America & Caribbean Latin America & Caribbean (excluding high income)Latin America & the Caribbean (IDA & IBRD countries)LatviaLeast developed countries: UN classificationLebanonLesothoLiberiaLibyaLiechtensteinLithuaniaLow & middle incomeLow incomeLower middle incomeLuxembourgMacao SAR, ChinaMacedonia, FYRMadagascarMalawiMalaysiaMaldivesMaliMaltaMarshall IslandsMauritaniaMauritiusMexicoMicronesia, Fed. Sts.Middle East & North AfricaMiddle East & North Africa (excluding high income)Middle East & North Africa (IDA & IBRD countries)Middle incomeMoldovaMongoliaMontenegroMoroccoMozambiqueMyanmarNamibiaNauruNepalNetherlandsNew CaledoniaNew ZealandNicaraguaNigerNigeriaNorth AmericaNorwayOECD membersOmanOther small statesPacific island small statesPakistanPalauPanamaPapua New GuineaParaguayPeruPhilippinesPolandPortugalPost-demographic dividendPre-demographic dividendQatarRomaniaRussian FederationRwandaSamoaSao Tome and PrincipeSaudi ArabiaSenegalSerbiaSeychellesSierra LeoneSingaporeSint Maarten (Dutch part)Slovak RepublicSloveniaSmall statesSolomon IslandsSomaliaSouth AfricaSouth AsiaSouth Asia (IDA & IBRD)South SudanSpainSri LankaSt. Kitts and NevisSt. LuciaSt. Vincent and the GrenadinesSub-Saharan Africa Sub-Saharan Africa (excluding high income)Sub-Saharan Africa (IDA & IBRD countries)SudanSurinameSwazilandSwedenSwitzerlandSyrian Arab RepublicTajikistanTanzaniaThailandTimor-LesteTogoTongaTrinidad and TobagoTunisiaTurkeyTurkmenistanTurks and Caicos IslandsUgandaUkraineUnited Arab EmiratesUnited KingdomUnited StatesUpper middle incomeUruguayUzbekistanVanuatuVenezuela, RBVietnamWest Bank and GazaWorldYemen, Rep.ZambiaZimbabwe Zeitlinie:
Diese Zeitleiste vorliegt die Graphik ab 1961 J. bis 2014 J. Low income. Die Angaben bis 1960 J. sind nicht vorhanden. Die Zahl aktueller Beobachtungen nach Daten: 54.
Die Quelle (Bezeichnung):
Kennzahlen der Weltentwicklung
Die Quelle (Einrichtung):
Carbon Dioxide Information Analysis Center, Environmental Sciences Division, Oak Ridge National Laboratory, Tennessee, United States.
Kategorien:
Climate Change, Environment
Es wurde aktualisiert:
23 Apr 2017 Jahr
Kennzahlen der Wertänderungen vom Jahr zum Jahr
Minimum:
24.127
1 Jan 1998 Jahr
Maximum:
65.59
1 Jan 2001 Jahr
Zum Datum der Beobachtung
Wert
Absolute Veränderung
Die Veränderung bezüglich dem vorherigen Wert
1 Jan 1961 Jahr
26.378
+26.378
0.0%
1 Jan 1962 Jahr
26.954
+0.576
2.18%
1 Jan 1963 Jahr
26.786
-0.168
-0.62%
1 Jan 1964 Jahr
24.134
-2.651
-9.9%
1 Jan 1965 Jahr
37.055
+12.921
53.54%
1 Jan 1966 Jahr
34.462
-2.593
-7.0%
1 Jan 1967 Jahr
37.757
+3.295
9.56%
1 Jan 1968 Jahr
34.797
-2.96
-7.84%
1 Jan 1969 Jahr
33.318
-1.479
-4.25%
1 Jan 1970 Jahr
31.422
-1.895
-5.69%
1 Jan 1971 Jahr
33.104
+1.682
5.35%
1 Jan 1972 Jahr
32.043
-1.061
-3.21%
1 Jan 1973 Jahr
29.866
-2.177
-6.79%
1 Jan 1974 Jahr
31.021
+1.156
3.87%
1 Jan 1975 Jahr
29.932
-1.089
-3.51%
1 Jan 1976 Jahr
26.571
-3.361
-11.23%
1 Jan 1977 Jahr
35.028
+8.457
31.83%
1 Jan 1978 Jahr
29.703
-5.325
-15.2%
1 Jan 1979 Jahr
28.453
-1.25
-4.21%
1 Jan 1980 Jahr
26.719
-1.734
-6.09%
1 Jan 1981 Jahr
26.861
+0.142
0.53%
1 Jan 1982 Jahr
26.355
-0.506
-1.88%
1 Jan 1983 Jahr
28.064
+1.709
6.49%
1 Jan 1984 Jahr
29.463
+1.398
4.98%
1 Jan 1985 Jahr
27.959
-1.504
-5.11%
1 Jan 1986 Jahr
28.068
+0.11
0.39%
1 Jan 1987 Jahr
32.569
+4.501
16.04%
1 Jan 1988 Jahr
35.469
+2.9
8.9%
1 Jan 1989 Jahr
35.187
-0.282
-0.79%
1 Jan 1990 Jahr
34.291
-0.897
-2.55%
1 Jan 1991 Jahr
35.356
+1.065
3.11%
1 Jan 1992 Jahr
32.462
-2.893
-8.18%
1 Jan 1993 Jahr
33.84
+1.378
4.24%
1 Jan 1994 Jahr
32.089
-1.752
-5.18%
1 Jan 1995 Jahr
33.463
+1.374
4.28%
1 Jan 1996 Jahr
26.434
-7.029
-21.01%
1 Jan 1997 Jahr
25.917
-0.517
-1.95%
1 Jan 1998 Jahr
24.127
-1.79
-6.91%
1 Jan 1999 Jahr
62.252
+38.125
158.02%
1 Jan 2000 Jahr
64.501
+2.249
3.61%
1 Jan 2001 Jahr
65.59
+1.089
1.69%
1 Jan 2002 Jahr
64.964
-0.627
-0.96%
1 Jan 2003 Jahr
63.286
-1.677
-2.58%
1 Jan 2004 Jahr
61.939
-1.347
-2.13%
1 Jan 2005 Jahr
61.425
-0.515
-0.83%
1 Jan 2006 Jahr
61.93
+0.506
0.82%
1 Jan 2007 Jahr
61.481
-0.45
-0.73%
1 Jan 2008 Jahr
56.028
-5.453
-8.87%
1 Jan 2009 Jahr
55.533
-0.494
-0.88%
1 Jan 2010 Jahr
54.225
-1.309
-2.36%
1 Jan 2011 Jahr
50.409
-3.815
-7.04%
1 Jan 2012 Jahr
42.197
-8.212
-16.29%
1 Jan 2013 Jahr
38.736
-3.462
-8.2%
1 Jan 2014 Jahr
37.83
-0.905
-2.34%
Bewertung der Länder gemäß mit laufender Statistik nach Jahren


Kommentare: