29
/de/
de
AIzaSyAYiBZKx7MnpbEhh9jyipgxe19OcubqV5w
April 1, 2024
261992
Thailand
THA
true
2
1
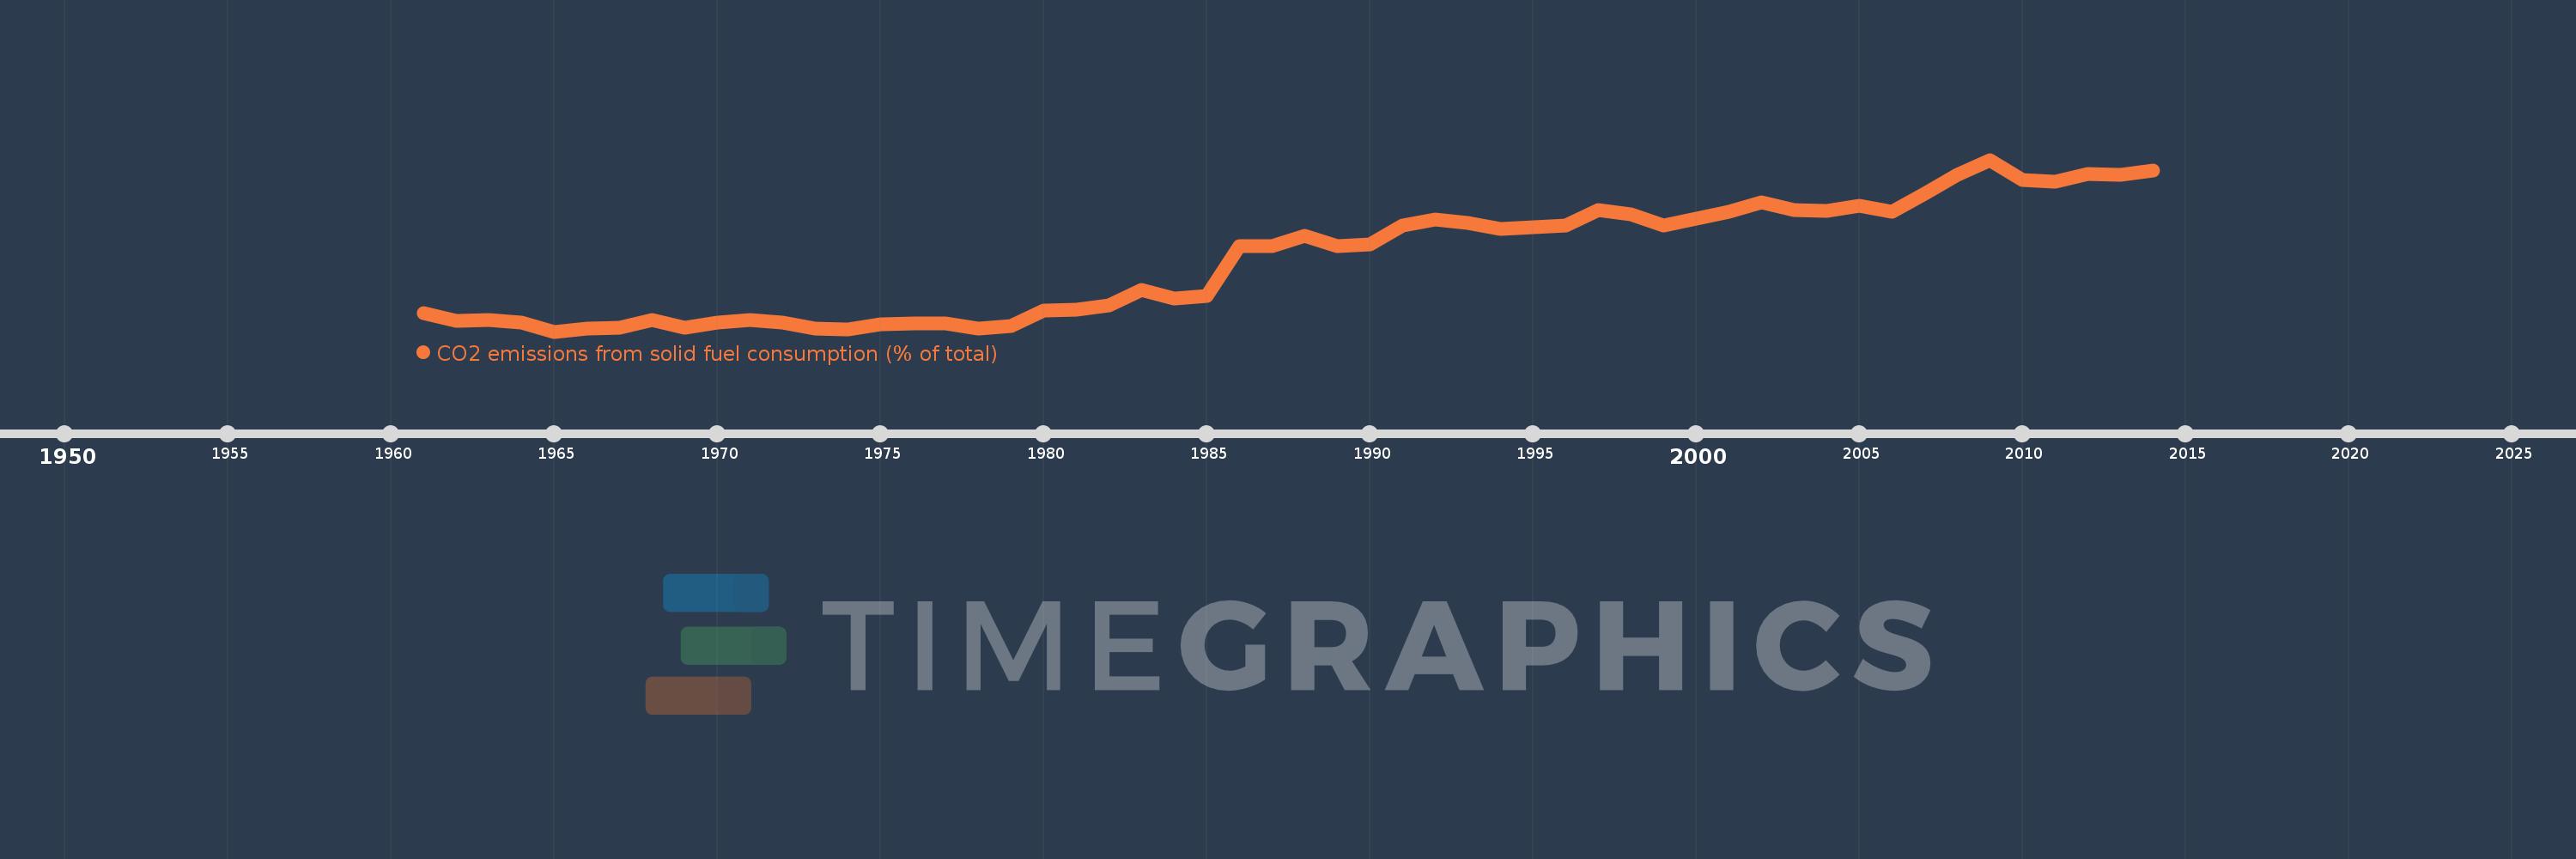
CO2 emissions from solid fuel consumption (% of total)
2014,2013,2012,2011,2010,2009,2008,2007,2006,2005,2004,2003,2002,2001,2000,1999,1998,1997,1996,1995,1994,1993,1992,1991,1990,1989,1988,1987,1986,1985,1984,1983,1982,1981,1980,1979,1978,1977,1976,1975,1974,1973,1972,1971,1970,1969,1968,1967,1966,1965,1964,1963,1962,1961
Diese Statistik in anderen Ländern:
AfghanistanAlbaniaAlgeriaAndorraAngolaAntigua and BarbudaArab WorldArgentinaArmeniaArubaAustraliaAustriaAzerbaijanBahamas, TheBahrainBangladeshBarbadosBelarusBelgiumBelizeBeninBermudaBhutanBoliviaBosnia and HerzegovinaBotswanaBrazilBritish Virgin IslandsBrunei DarussalamBulgariaBurkina FasoBurundiCabo VerdeCambodiaCameroonCanadaCaribbean small statesCayman IslandsCentral African RepublicCentral Europe and the BalticsChadChileChinaColombiaComorosCongo, Dem. Rep.Congo, Rep.Costa RicaCote d'IvoireCroatiaCubaCuracaoCyprusCzech RepublicDenmarkDjiboutiDominicaDominican RepublicEarly-demographic dividendEast Asia & PacificEast Asia & Pacific (excluding high income)East Asia & Pacific (IDA & IBRD countries)EcuadorEgypt, Arab Rep.El SalvadorEquatorial GuineaEritreaEstoniaEthiopiaEuro areaEurope & Central AsiaEurope & Central Asia (excluding high income)Europe & Central Asia (IDA & IBRD countries)European UnionFaroe IslandsFijiFinlandFragile and conflict affected situationsFranceFrench PolynesiaGabonGambia, TheGeorgiaGermanyGhanaGibraltarGreeceGreenlandGrenadaGuatemalaGuineaGuinea-BissauGuyanaHaitiHeavily indebted poor countries (HIPC)High incomeHondurasHong Kong SAR, ChinaHungaryIBRD onlyIcelandIDA & IBRD totalIDA blendIDA onlyIDA totalIndiaIndonesiaIran, Islamic Rep.IraqIrelandIsraelItalyJamaicaJapanJordanKazakhstanKenyaKiribatiKorea, Dem. People’s Rep.Korea, Rep.KuwaitKyrgyz RepublicLao PDRLate-demographic dividendLatin America & Caribbean Latin America & Caribbean (excluding high income)Latin America & the Caribbean (IDA & IBRD countries)LatviaLeast developed countries: UN classificationLebanonLesothoLiberiaLibyaLiechtensteinLithuaniaLow & middle incomeLow incomeLower middle incomeLuxembourgMacao SAR, ChinaMacedonia, FYRMadagascarMalawiMalaysiaMaldivesMaliMaltaMarshall IslandsMauritaniaMauritiusMexicoMicronesia, Fed. Sts.Middle East & North AfricaMiddle East & North Africa (excluding high income)Middle East & North Africa (IDA & IBRD countries)Middle incomeMoldovaMongoliaMontenegroMoroccoMozambiqueMyanmarNamibiaNauruNepalNetherlandsNew CaledoniaNew ZealandNicaraguaNigerNigeriaNorth AmericaNorwayOECD membersOmanOther small statesPacific island small statesPakistanPalauPanamaPapua New GuineaParaguayPeruPhilippinesPolandPortugalPost-demographic dividendPre-demographic dividendQatarRomaniaRussian FederationRwandaSamoaSao Tome and PrincipeSaudi ArabiaSenegalSerbiaSeychellesSierra LeoneSingaporeSint Maarten (Dutch part)Slovak RepublicSloveniaSmall statesSolomon IslandsSomaliaSouth AfricaSouth AsiaSouth Asia (IDA & IBRD)South SudanSpainSri LankaSt. Kitts and NevisSt. LuciaSt. Vincent and the GrenadinesSub-Saharan Africa Sub-Saharan Africa (excluding high income)Sub-Saharan Africa (IDA & IBRD countries)SudanSurinameSwazilandSwedenSwitzerlandSyrian Arab RepublicTajikistanTanzaniaThailandTimor-LesteTogoTongaTrinidad and TobagoTunisiaTurkeyTurkmenistanTurks and Caicos IslandsUgandaUkraineUnited Arab EmiratesUnited KingdomUnited StatesUpper middle incomeUruguayUzbekistanVanuatuVenezuela, RBVietnamWest Bank and GazaWorldYemen, Rep.ZambiaZimbabwe Zeitlinie:
Diese Zeitleiste vorliegt die Graphik ab 1961 J. bis 2014 J. Thailand. Die Angaben bis 1960 J. sind nicht vorhanden. Die Zahl aktueller Beobachtungen nach Daten: 54.
Die Quelle (Bezeichnung):
Kennzahlen der Weltentwicklung
Die Quelle (Einrichtung):
Carbon Dioxide Information Analysis Center, Environmental Sciences Division, Oak Ridge National Laboratory, Tennessee, United States.
Kategorien:
Climate Change, Environment
Es wurde aktualisiert:
23 Apr 2017 Jahr
Kennzahlen der Wertänderungen vom Jahr zum Jahr
Minimum:
1.569
1 Jan 1965 Jahr
Maximum:
23.209
1 Jan 2009 Jahr
Zum Datum der Beobachtung
Wert
Absolute Veränderung
Die Veränderung bezüglich dem vorherigen Wert
1 Jan 1961 Jahr
3.949
+3.949
0.0%
1 Jan 1962 Jahr
2.918
-1.031
-26.11%
1 Jan 1963 Jahr
2.986
+0.068
2.34%
1 Jan 1964 Jahr
2.699
-0.287
-9.61%
1 Jan 1965 Jahr
1.569
-1.131
-41.88%
1 Jan 1966 Jahr
1.969
+0.4
25.49%
1 Jan 1967 Jahr
2.05
+0.082
4.15%
1 Jan 1968 Jahr
3.074
+1.024
49.94%
1 Jan 1969 Jahr
2.037
-1.037
-33.73%
1 Jan 1970 Jahr
2.695
+0.657
32.26%
1 Jan 1971 Jahr
3.005
+0.31
11.52%
1 Jan 1972 Jahr
2.743
-0.262
-8.71%
1 Jan 1973 Jahr
1.898
-0.846
-30.83%
1 Jan 1974 Jahr
1.814
-0.083
-4.38%
1 Jan 1975 Jahr
2.526
+0.711
39.21%
1 Jan 1976 Jahr
2.584
+0.058
2.31%
1 Jan 1977 Jahr
2.561
-0.023
-0.89%
1 Jan 1978 Jahr
1.961
-0.6
-23.42%
1 Jan 1979 Jahr
2.269
+0.308
15.7%
1 Jan 1980 Jahr
4.192
+1.923
84.76%
1 Jan 1981 Jahr
4.312
+0.12
2.86%
1 Jan 1982 Jahr
4.857
+0.545
12.64%
1 Jan 1983 Jahr
6.8
+1.943
40.0%
1 Jan 1984 Jahr
5.779
-1.021
-15.02%
1 Jan 1985 Jahr
6.054
+0.275
4.77%
1 Jan 1986 Jahr
12.296
+6.242
103.1%
1 Jan 1987 Jahr
12.299
+0.003
0.03%
1 Jan 1988 Jahr
13.613
+1.314
10.69%
1 Jan 1989 Jahr
12.363
-1.25
-9.18%
1 Jan 1990 Jahr
12.601
+0.238
1.92%
1 Jan 1991 Jahr
14.978
+2.377
18.86%
1 Jan 1992 Jahr
15.666
+0.688
4.6%
1 Jan 1993 Jahr
15.212
-0.455
-2.9%
1 Jan 1994 Jahr
14.513
-0.699
-4.6%
1 Jan 1995 Jahr
14.765
+0.252
1.74%
1 Jan 1996 Jahr
14.95
+0.185
1.25%
1 Jan 1997 Jahr
16.836
+1.886
12.62%
1 Jan 1998 Jahr
16.371
-0.465
-2.76%
1 Jan 1999 Jahr
14.932
-1.439
-8.79%
1 Jan 2000 Jahr
15.773
+0.842
5.64%
1 Jan 2001 Jahr
16.61
+0.837
5.31%
1 Jan 2002 Jahr
17.877
+1.267
7.63%
1 Jan 2003 Jahr
16.87
-1.007
-5.63%
1 Jan 2004 Jahr
16.773
-0.097
-0.58%
1 Jan 2005 Jahr
17.368
+0.595
3.55%
1 Jan 2006 Jahr
16.66
-0.708
-4.08%
1 Jan 2007 Jahr
18.926
+2.266
13.6%
1 Jan 2008 Jahr
21.35
+2.424
12.81%
1 Jan 2009 Jahr
23.209
+1.859
8.71%
1 Jan 2010 Jahr
20.648
-2.56
-11.03%
1 Jan 2011 Jahr
20.456
-0.192
-0.93%
1 Jan 2012 Jahr
21.434
+0.978
4.78%
1 Jan 2013 Jahr
21.335
-0.099
-0.46%
1 Jan 2014 Jahr
21.864
+0.529
2.48%
Bewertung der Länder gemäß mit laufender Statistik nach Jahren


Kommentare: