29
/de/
de
AIzaSyAYiBZKx7MnpbEhh9jyipgxe19OcubqV5w
April 1, 2024
44617
Least developed countries: UN classification
LDC
false
2
1
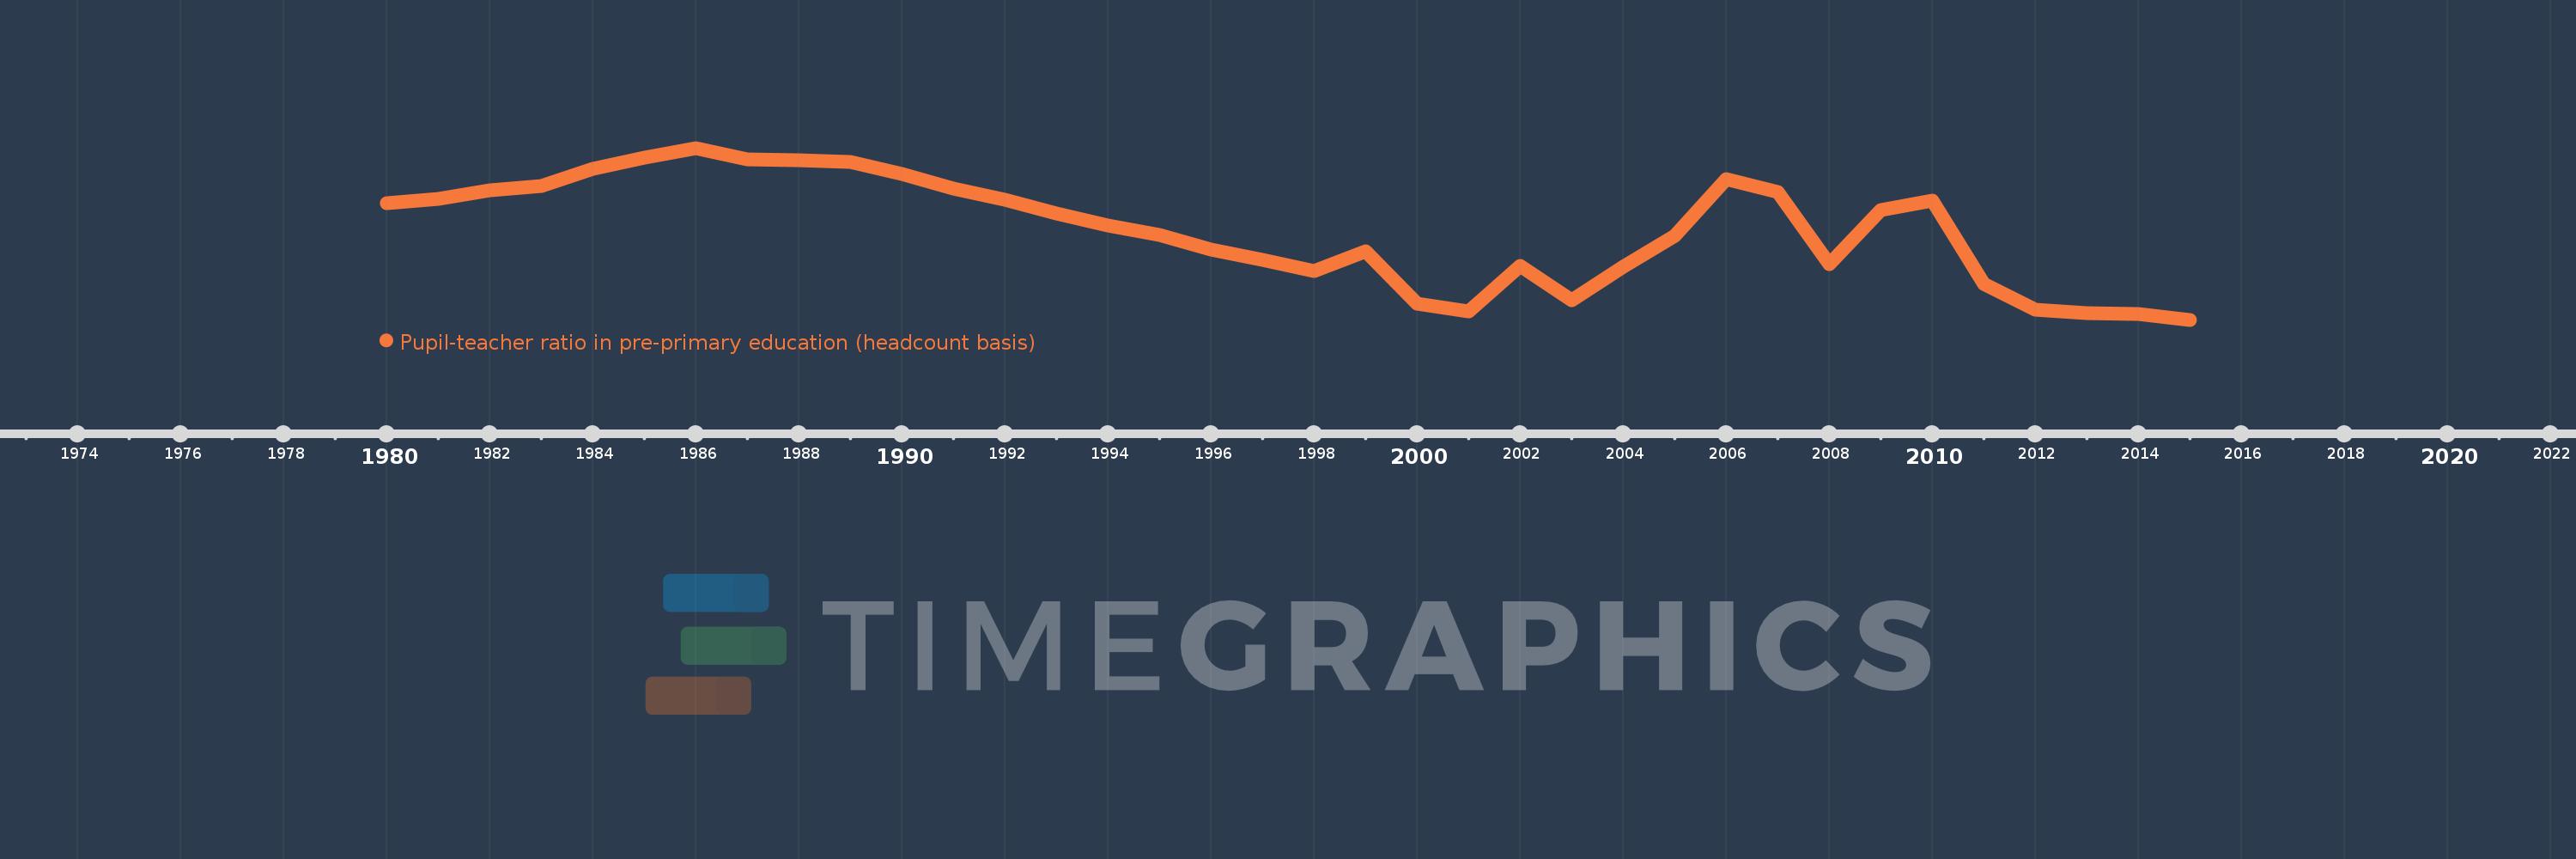
Pupil-teacher ratio in pre-primary education (headcount basis)
2015,2014,2013,2012,2011,2010,2009,2008,2007,2006,2005,2004,2003,2002,2001,2000,1999,1998,1997,1996,1995,1994,1993,1992,1991,1990,1989,1988,1987,1986,1985,1984,1983,1982,1981,1980
Diese Statistik in anderen Ländern:
AfghanistanAlbaniaAlgeriaAndorraAngolaAntigua and BarbudaArab WorldArgentinaArmeniaArubaAustriaAzerbaijanBahamas, TheBahrainBangladeshBarbadosBelarusBelgiumBelizeBeninBermudaBhutanBoliviaBosnia and HerzegovinaBotswanaBrazilBritish Virgin IslandsBrunei DarussalamBulgariaBurkina FasoBurundiCabo VerdeCambodiaCameroonCanadaCaribbean small statesCayman IslandsCentral African RepublicCentral Europe and the BalticsChadChileChinaColombiaComorosCongo, Dem. Rep.Congo, Rep.Costa RicaCote d'IvoireCroatiaCubaCyprusCzech RepublicDenmarkDjiboutiDominicaDominican RepublicEarly-demographic dividendEast Asia & PacificEast Asia & Pacific (excluding high income)East Asia & Pacific (IDA & IBRD countries)EcuadorEgypt, Arab Rep.El SalvadorEquatorial GuineaEritreaEstoniaEthiopiaEuro areaEurope & Central AsiaEurope & Central Asia (excluding high income)Europe & Central Asia (IDA & IBRD countries)European UnionFijiFinlandFragile and conflict affected situationsFranceGabonGambia, TheGeorgiaGermanyGhanaGibraltarGreeceGrenadaGuatemalaGuineaGuinea-BissauGuyanaHaitiHeavily indebted poor countries (HIPC)High incomeHondurasHong Kong SAR, ChinaHungaryIBRD onlyIcelandIDA & IBRD totalIDA blendIDA onlyIDA totalIndiaIndonesiaIran, Islamic Rep.IraqIrelandIsraelItalyJamaicaJapanJordanKazakhstanKenyaKorea, Dem. People’s Rep.Korea, Rep.KuwaitKyrgyz RepublicLao PDRLate-demographic dividendLatin America & Caribbean Latin America & Caribbean (excluding high income)Latin America & the Caribbean (IDA & IBRD countries)LatviaLeast developed countries: UN classificationLebanonLesothoLiberiaLibyaLiechtensteinLithuaniaLow & middle incomeLow incomeLower middle incomeLuxembourgMacao SAR, ChinaMacedonia, FYRMadagascarMalaysiaMaldivesMaliMaltaMarshall IslandsMauritaniaMauritiusMexicoMiddle East & North AfricaMiddle East & North Africa (excluding high income)Middle East & North Africa (IDA & IBRD countries)Middle incomeMoldovaMonacoMongoliaMontenegroMoroccoMozambiqueMyanmarNamibiaNauruNepalNetherlandsNew ZealandNicaraguaNigerNigeriaNorth AmericaNorwayOECD membersOmanOther small statesPacific island small statesPalauPanamaPapua New GuineaParaguayPeruPhilippinesPolandPortugalPost-demographic dividendPre-demographic dividendPuerto RicoQatarRomaniaRussian FederationRwandaSamoaSan MarinoSao Tome and PrincipeSaudi ArabiaSenegalSerbiaSeychellesSierra LeoneSingaporeSlovak RepublicSloveniaSmall statesSolomon IslandsSomaliaSouth AfricaSouth AsiaSouth Asia (IDA & IBRD)South SudanSpainSt. Kitts and NevisSt. LuciaSt. Vincent and the GrenadinesSub-Saharan Africa Sub-Saharan Africa (excluding high income)Sub-Saharan Africa (IDA & IBRD countries)SudanSurinameSwazilandSwedenSwitzerlandSyrian Arab RepublicTajikistanTanzaniaThailandTimor-LesteTogoTongaTrinidad and TobagoTunisiaTurkeyTurks and Caicos IslandsTuvaluUgandaUkraineUnited Arab EmiratesUnited KingdomUnited StatesUpper middle incomeUruguayUzbekistanVanuatuVenezuela, RBVietnamWest Bank and GazaWorldYemen, Rep.Zimbabwe Zeitlinie:
Diese Zeitleiste vorliegt die Graphik ab 1980 J. bis 2015 J. Least developed countries: UN classification. Die Angaben bis 1979 J. sind nicht vorhanden. Die Zahl aktueller Beobachtungen nach Daten: 36.
Die Quelle (Bezeichnung):
Kennzahlen der Weltentwicklung
Die Quelle (Einrichtung):
UNESCO Institute for Statistics
Kategorien:
Education
Es wurde aktualisiert:
23 Apr 2017 Jahr
Kennzahlen der Wertänderungen vom Jahr zum Jahr
Minimum:
26.325
1 Jan 2015 Jahr
Maximum:
32.138
1 Jan 1986 Jahr
Zum Datum der Beobachtung
Wert
Absolute Veränderung
Die Veränderung bezüglich dem vorherigen Wert
1 Jan 1980 Jahr
30.282
+30.282
0.0%
1 Jan 1981 Jahr
30.409
+0.127
0.42%
1 Jan 1982 Jahr
30.693
+0.283
0.93%
1 Jan 1983 Jahr
30.843
+0.15
0.49%
1 Jan 1984 Jahr
31.436
+0.594
1.92%
1 Jan 1985 Jahr
31.805
+0.369
1.17%
1 Jan 1986 Jahr
32.138
+0.333
1.05%
1 Jan 1987 Jahr
31.759
-0.379
-1.18%
1 Jan 1988 Jahr
31.709
-0.05
-0.16%
1 Jan 1989 Jahr
31.667
-0.042
-0.13%
1 Jan 1990 Jahr
31.248
-0.419
-1.32%
1 Jan 1991 Jahr
30.776
-0.471
-1.51%
1 Jan 1992 Jahr
30.383
-0.393
-1.28%
1 Jan 1993 Jahr
29.908
-0.475
-1.56%
1 Jan 1994 Jahr
29.512
-0.397
-1.33%
1 Jan 1995 Jahr
29.181
-0.33
-1.12%
1 Jan 1996 Jahr
28.691
-0.49
-1.68%
1 Jan 1997 Jahr
28.344
-0.347
-1.21%
1 Jan 1998 Jahr
27.974
-0.37
-1.3%
1 Jan 1999 Jahr
28.652
+0.678
2.42%
1 Jan 2000 Jahr
26.864
-1.787
-6.24%
1 Jan 2001 Jahr
26.595
-0.27
-1.0%
1 Jan 2002 Jahr
28.149
+1.555
5.85%
1 Jan 2003 Jahr
26.991
-1.159
-4.12%
1 Jan 2004 Jahr
28.125
+1.134
4.2%
1 Jan 2005 Jahr
29.167
+1.043
3.71%
1 Jan 2006 Jahr
31.071
+1.904
6.53%
1 Jan 2007 Jahr
30.648
-0.423
-1.36%
1 Jan 2008 Jahr
28.202
-2.446
-7.98%
1 Jan 2009 Jahr
30.026
+1.824
6.47%
1 Jan 2010 Jahr
30.342
+0.316
1.05%
1 Jan 2011 Jahr
27.534
-2.808
-9.26%
1 Jan 2012 Jahr
26.676
-0.858
-3.12%
1 Jan 2013 Jahr
26.56
-0.116
-0.43%
1 Jan 2014 Jahr
26.511
-0.05
-0.19%
1 Jan 2015 Jahr
26.325
-0.185
-0.7%
Bewertung der Länder gemäß mit laufender Statistik nach Jahren


Kommentare: