29
/de/
de
AIzaSyAYiBZKx7MnpbEhh9jyipgxe19OcubqV5w
April 1, 2024
26077
Central Europe and the Baltics
CEB
false
2
1
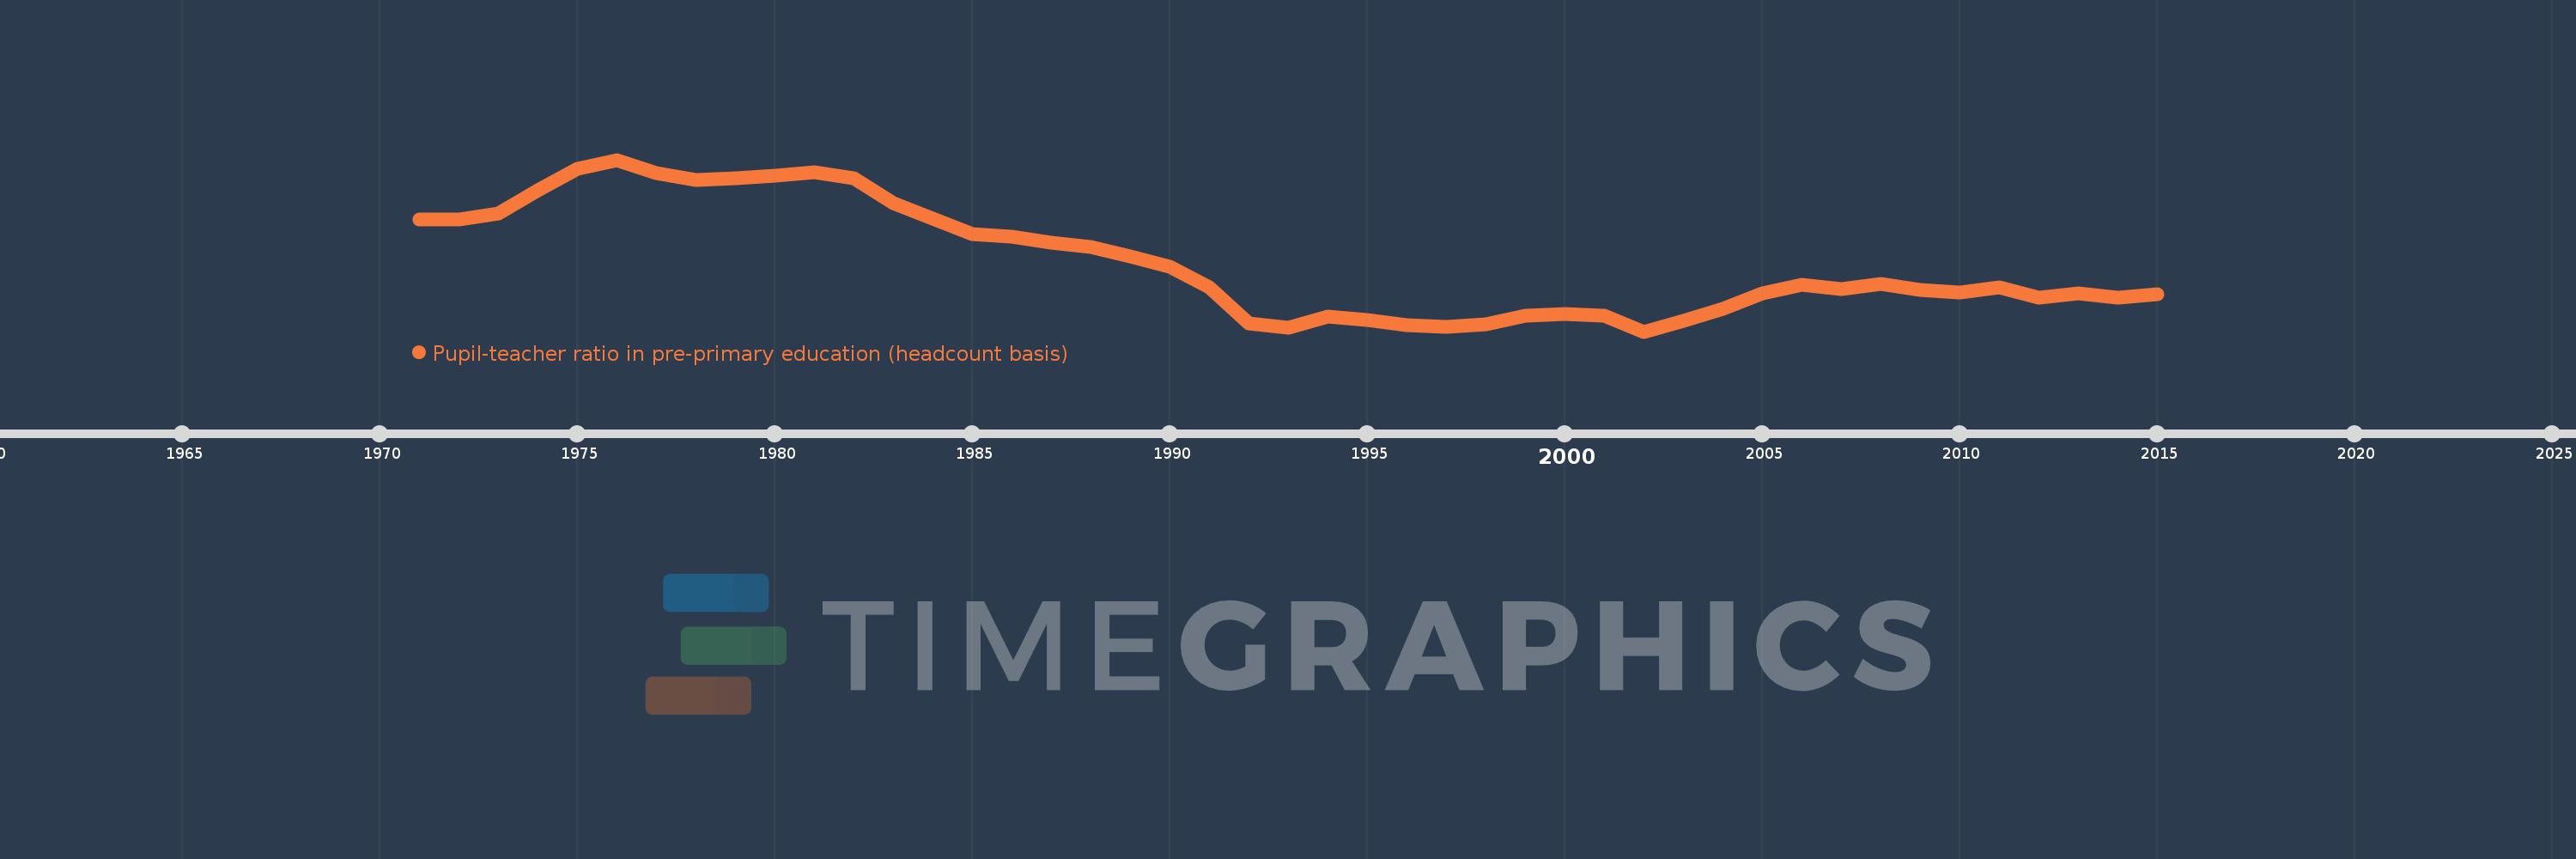
Pupil-teacher ratio in pre-primary education (headcount basis)
2015,2014,2013,2012,2011,2010,2009,2008,2007,2006,2005,2004,2003,2002,2001,2000,1999,1998,1997,1996,1995,1994,1993,1992,1991,1990,1989,1988,1987,1986,1985,1984,1983,1982,1981,1980,1979,1978,1977,1976,1975,1974,1973,1972,1971
Diese Statistik in anderen Ländern:
AfghanistanAlbaniaAlgeriaAndorraAngolaAntigua and BarbudaArab WorldArgentinaArmeniaArubaAustriaAzerbaijanBahamas, TheBahrainBangladeshBarbadosBelarusBelgiumBelizeBeninBermudaBhutanBoliviaBosnia and HerzegovinaBotswanaBrazilBritish Virgin IslandsBrunei DarussalamBulgariaBurkina FasoBurundiCabo VerdeCambodiaCameroonCanadaCaribbean small statesCayman IslandsCentral African RepublicCentral Europe and the BalticsChadChileChinaColombiaComorosCongo, Dem. Rep.Congo, Rep.Costa RicaCote d'IvoireCroatiaCubaCyprusCzech RepublicDenmarkDjiboutiDominicaDominican RepublicEarly-demographic dividendEast Asia & PacificEast Asia & Pacific (excluding high income)East Asia & Pacific (IDA & IBRD countries)EcuadorEgypt, Arab Rep.El SalvadorEquatorial GuineaEritreaEstoniaEthiopiaEuro areaEurope & Central AsiaEurope & Central Asia (excluding high income)Europe & Central Asia (IDA & IBRD countries)European UnionFijiFinlandFragile and conflict affected situationsFranceGabonGambia, TheGeorgiaGermanyGhanaGibraltarGreeceGrenadaGuatemalaGuineaGuinea-BissauGuyanaHaitiHeavily indebted poor countries (HIPC)High incomeHondurasHong Kong SAR, ChinaHungaryIBRD onlyIcelandIDA & IBRD totalIDA blendIDA onlyIDA totalIndiaIndonesiaIran, Islamic Rep.IraqIrelandIsraelItalyJamaicaJapanJordanKazakhstanKenyaKorea, Dem. People’s Rep.Korea, Rep.KuwaitKyrgyz RepublicLao PDRLate-demographic dividendLatin America & Caribbean Latin America & Caribbean (excluding high income)Latin America & the Caribbean (IDA & IBRD countries)LatviaLeast developed countries: UN classificationLebanonLesothoLiberiaLibyaLiechtensteinLithuaniaLow & middle incomeLow incomeLower middle incomeLuxembourgMacao SAR, ChinaMacedonia, FYRMadagascarMalaysiaMaldivesMaliMaltaMarshall IslandsMauritaniaMauritiusMexicoMiddle East & North AfricaMiddle East & North Africa (excluding high income)Middle East & North Africa (IDA & IBRD countries)Middle incomeMoldovaMonacoMongoliaMontenegroMoroccoMozambiqueMyanmarNamibiaNauruNepalNetherlandsNew ZealandNicaraguaNigerNigeriaNorth AmericaNorwayOECD membersOmanOther small statesPacific island small statesPalauPanamaPapua New GuineaParaguayPeruPhilippinesPolandPortugalPost-demographic dividendPre-demographic dividendPuerto RicoQatarRomaniaRussian FederationRwandaSamoaSan MarinoSao Tome and PrincipeSaudi ArabiaSenegalSerbiaSeychellesSierra LeoneSingaporeSlovak RepublicSloveniaSmall statesSolomon IslandsSomaliaSouth AfricaSouth AsiaSouth Asia (IDA & IBRD)South SudanSpainSt. Kitts and NevisSt. LuciaSt. Vincent and the GrenadinesSub-Saharan Africa Sub-Saharan Africa (excluding high income)Sub-Saharan Africa (IDA & IBRD countries)SudanSurinameSwazilandSwedenSwitzerlandSyrian Arab RepublicTajikistanTanzaniaThailandTimor-LesteTogoTongaTrinidad and TobagoTunisiaTurkeyTurks and Caicos IslandsTuvaluUgandaUkraineUnited Arab EmiratesUnited KingdomUnited StatesUpper middle incomeUruguayUzbekistanVanuatuVenezuela, RBVietnamWest Bank and GazaWorldYemen, Rep.Zimbabwe Zeitlinie:
Diese Zeitleiste vorliegt die Graphik ab 1971 J. bis 2015 J. Central Europe and the Baltics. Die Angaben bis 1970 J. sind nicht vorhanden. Die Zahl aktueller Beobachtungen nach Daten: 45.
Die Quelle (Bezeichnung):
Kennzahlen der Weltentwicklung
Die Quelle (Einrichtung):
UNESCO Institute for Statistics
Kategorien:
Education
Es wurde aktualisiert:
23 Apr 2017 Jahr
Kennzahlen der Wertänderungen vom Jahr zum Jahr
Minimum:
12.221
1 Jan 2002 Jahr
Maximum:
18.29
1 Jan 1976 Jahr
Zum Datum der Beobachtung
Wert
Absolute Veränderung
Die Veränderung bezüglich dem vorherigen Wert
1 Jan 1971 Jahr
16.184
+16.184
0.0%
1 Jan 1972 Jahr
16.196
+0.012
0.07%
1 Jan 1973 Jahr
16.397
+0.201
1.24%
1 Jan 1974 Jahr
17.2
+0.803
4.9%
1 Jan 1975 Jahr
17.98
+0.78
4.53%
1 Jan 1976 Jahr
18.29
+0.311
1.73%
1 Jan 1977 Jahr
17.816
-0.474
-2.59%
1 Jan 1978 Jahr
17.576
-0.24
-1.35%
1 Jan 1979 Jahr
17.647
+0.071
0.4%
1 Jan 1980 Jahr
17.726
+0.08
0.45%
1 Jan 1981 Jahr
17.838
+0.112
0.63%
1 Jan 1982 Jahr
17.633
-0.205
-1.15%
1 Jan 1983 Jahr
16.763
-0.871
-4.94%
1 Jan 1984 Jahr
16.22
-0.542
-3.23%
1 Jan 1985 Jahr
15.66
-0.561
-3.46%
1 Jan 1986 Jahr
15.574
-0.085
-0.54%
1 Jan 1987 Jahr
15.362
-0.213
-1.37%
1 Jan 1988 Jahr
15.204
-0.158
-1.03%
1 Jan 1989 Jahr
14.875
-0.329
-2.16%
1 Jan 1990 Jahr
14.506
-0.369
-2.48%
1 Jan 1991 Jahr
13.787
-0.718
-4.95%
1 Jan 1992 Jahr
12.503
-1.285
-9.32%
1 Jan 1993 Jahr
12.371
-0.132
-1.06%
1 Jan 1994 Jahr
12.741
+0.371
3.0%
1 Jan 1995 Jahr
12.634
-0.108
-0.85%
1 Jan 1996 Jahr
12.445
-0.189
-1.5%
1 Jan 1997 Jahr
12.387
-0.057
-0.46%
1 Jan 1998 Jahr
12.481
+0.094
0.76%
1 Jan 1999 Jahr
12.797
+0.316
2.53%
1 Jan 2000 Jahr
12.84
+0.042
0.33%
1 Jan 2001 Jahr
12.768
-0.072
-0.56%
1 Jan 2002 Jahr
12.221
-0.547
-4.28%
1 Jan 2003 Jahr
12.601
+0.38
3.11%
1 Jan 2004 Jahr
13.025
+0.424
3.36%
1 Jan 2005 Jahr
13.564
+0.539
4.14%
1 Jan 2006 Jahr
13.867
+0.304
2.24%
1 Jan 2007 Jahr
13.734
-0.133
-0.96%
1 Jan 2008 Jahr
13.892
+0.158
1.15%
1 Jan 2009 Jahr
13.707
-0.185
-1.33%
1 Jan 2010 Jahr
13.611
-0.096
-0.7%
1 Jan 2011 Jahr
13.788
+0.177
1.3%
1 Jan 2012 Jahr
13.431
-0.357
-2.59%
1 Jan 2013 Jahr
13.581
+0.15
1.12%
1 Jan 2014 Jahr
13.425
-0.156
-1.15%
1 Jan 2015 Jahr
13.535
+0.11
0.82%
Bewertung der Länder gemäß mit laufender Statistik nach Jahren


Kommentare: