29
/de/
de
AIzaSyAYiBZKx7MnpbEhh9jyipgxe19OcubqV5w
April 1, 2024
41503
Latin America & Caribbean
LCN
false
2
1
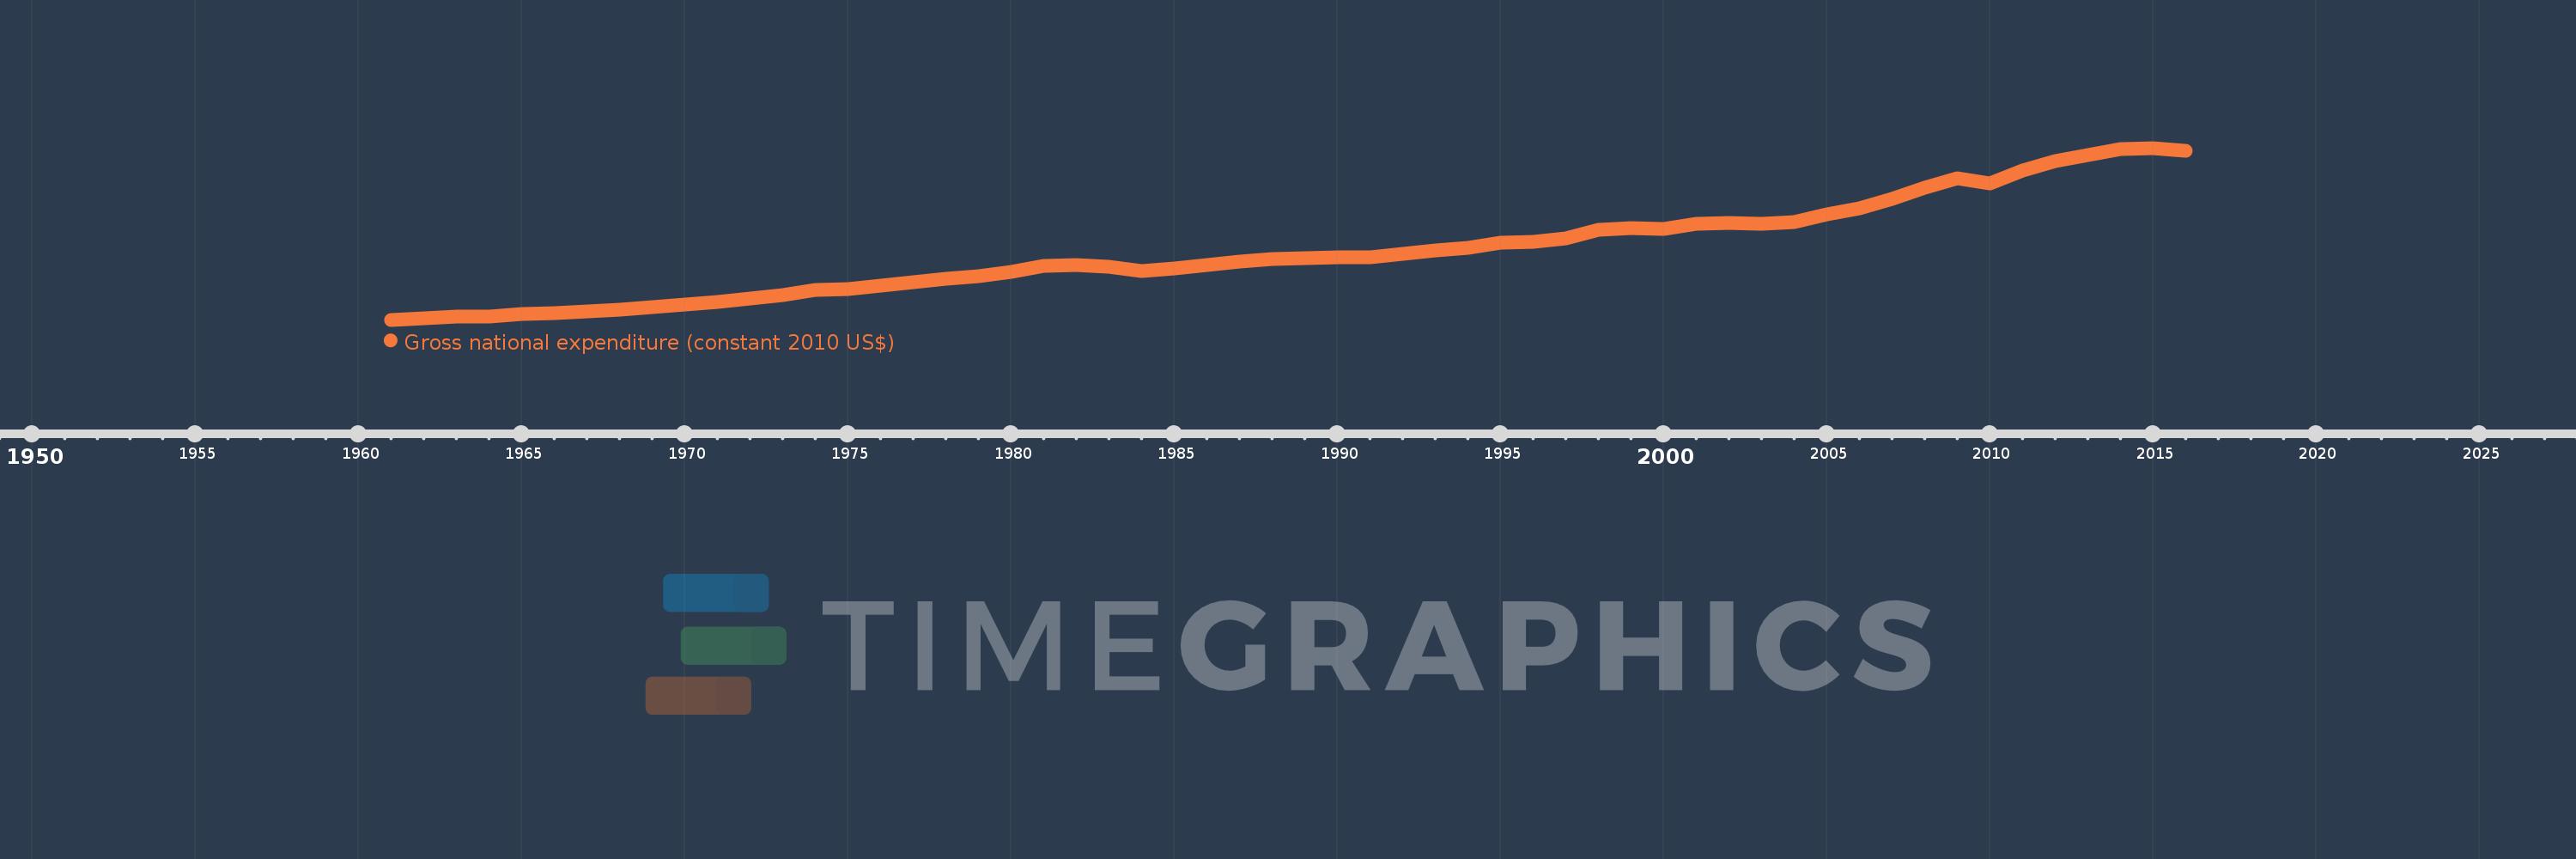
Gross national expenditure (constant 2010 US$)
2016,2015,2014,2013,2012,2011,2010,2009,2008,2007,2006,2005,2004,2003,2002,2001,2000,1999,1998,1997,1996,1995,1994,1993,1992,1991,1990,1989,1988,1987,1986,1985,1984,1983,1982,1981,1980,1979,1978,1977,1976,1975,1974,1973,1972,1971,1970,1969,1968,1967,1966,1965,1964,1963,1962,1961
Diese Statistik in anderen Ländern:
AfghanistanAlbaniaAlgeriaAngolaAntigua and BarbudaArab WorldArgentinaArmeniaArubaAustraliaAustriaAzerbaijanBahamas, TheBahrainBangladeshBarbadosBelarusBelgiumBelizeBeninBermudaBhutanBoliviaBosnia and HerzegovinaBotswanaBrazilBrunei DarussalamBulgariaBurkina FasoBurundiCabo VerdeCambodiaCameroonCanadaCaribbean small statesCentral African RepublicCentral Europe and the BalticsChadChileChinaColombiaComorosCongo, Dem. Rep.Congo, Rep.Costa RicaCote d'IvoireCroatiaCubaCyprusCzech RepublicDenmarkDominicaDominican RepublicEarly-demographic dividendEast Asia & PacificEast Asia & Pacific (excluding high income)East Asia & Pacific (IDA & IBRD countries)EcuadorEgypt, Arab Rep.El SalvadorEquatorial GuineaEritreaEstoniaEuro areaEurope & Central AsiaEurope & Central Asia (excluding high income)Europe & Central Asia (IDA & IBRD countries)European UnionFaroe IslandsFijiFinlandFragile and conflict affected situationsFranceGabonGambia, TheGeorgiaGermanyGhanaGreeceGrenadaGuatemalaGuineaGuinea-BissauGuyanaHaitiHeavily indebted poor countries (HIPC)High incomeHondurasHong Kong SAR, ChinaHungaryIBRD onlyIcelandIDA & IBRD totalIDA blendIDA onlyIDA totalIndiaIndonesiaIran, Islamic Rep.IraqIrelandIsraelItalyJamaicaJapanJordanKazakhstanKenyaKiribatiKorea, Rep.KosovoKuwaitKyrgyz RepublicLao PDRLate-demographic dividendLatin America & Caribbean Latin America & Caribbean (excluding high income)Latin America & the Caribbean (IDA & IBRD countries)LatviaLeast developed countries: UN classificationLebanonLiberiaLibyaLithuaniaLow & middle incomeLow incomeLower middle incomeLuxembourgMacao SAR, ChinaMacedonia, FYRMadagascarMalawiMalaysiaMaldivesMaliMaltaMauritaniaMauritiusMexicoMiddle East & North AfricaMiddle East & North Africa (excluding high income)Middle East & North Africa (IDA & IBRD countries)Middle incomeMoldovaMongoliaMontenegroMoroccoMozambiqueMyanmarNamibiaNepalNetherlandsNew ZealandNicaraguaNigerNigeriaNorth AmericaNorwayOECD membersOmanOther small statesPacific island small statesPakistanPalauPanamaParaguayPeruPhilippinesPolandPortugalPost-demographic dividendPre-demographic dividendPuerto RicoQatarRomaniaRussian FederationRwandaSamoaSaudi ArabiaSenegalSerbiaSeychellesSierra LeoneSingaporeSlovak RepublicSloveniaSmall statesSolomon IslandsSouth AfricaSouth AsiaSouth Asia (IDA & IBRD)South SudanSpainSri LankaSt. Kitts and NevisSt. LuciaSt. Vincent and the GrenadinesSub-Saharan Africa Sub-Saharan Africa (excluding high income)Sub-Saharan Africa (IDA & IBRD countries)SudanSurinameSwazilandSwedenSwitzerlandTajikistanTanzaniaThailandTimor-LesteTogoTongaTrinidad and TobagoTunisiaTurkeyTurkmenistanUgandaUkraineUnited Arab EmiratesUnited KingdomUnited StatesUpper middle incomeUruguayUzbekistanVanuatuVenezuela, RBVietnamWest Bank and GazaWorldYemen, Rep.ZambiaZimbabwe Zeitlinie:
Diese Zeitleiste vorliegt die Graphik ab 1961 J. bis 2016 J. Latin America & Caribbean . Die Angaben bis 1960 J. sind nicht vorhanden. Die Zahl aktueller Beobachtungen nach Daten: 56.
Die Quelle (Bezeichnung):
Kennzahlen der Weltentwicklung
Die Quelle (Einrichtung):
World Bank national accounts data, and OECD National Accounts data files.
Kategorien:
Economy & Growth
Es wurde aktualisiert:
23 Apr 2017 Jahr
Kennzahlen der Wertänderungen vom Jahr zum Jahr
im Durchschnitt:
2.848 Trln
Minimum:
756.854 Mlrd.
1 Jan 1961 Jahr
Maximum:
5.982 Trln
1 Jan 2015 Jahr
Zum Datum der Beobachtung
Wert
Absolute Veränderung
Die Veränderung bezüglich dem vorherigen Wert
1 Jan 1961 Jahr
756.854 Mlrd.
+756.854 Mlrd.
0.0%
1 Jan 1962 Jahr
809.449 Mlrd.
+52.594 Mlrd.
6.95%
1 Jan 1963 Jahr
841.619 Mlrd.
+32.171 Mlrd.
3.97%
1 Jan 1964 Jahr
857.881 Mlrd.
+16.262 Mlrd.
1.93%
1 Jan 1965 Jahr
921.171 Mlrd.
+63.29 Mlrd.
7.38%
1 Jan 1966 Jahr
966.551 Mlrd.
+45.38 Mlrd.
4.93%
1 Jan 1967 Jahr
1.012 Trln
+45.236 Mlrd.
4.68%
1 Jan 1968 Jahr
1.058 Trln
+46.342 Mlrd.
4.58%
1 Jan 1969 Jahr
1.144 Trln
+85.409 Mlrd.
8.07%
1 Jan 1970 Jahr
1.223 Trln
+79.258 Mlrd.
6.93%
1 Jan 1971 Jahr
1.306 Trln
+83.444 Mlrd.
6.82%
1 Jan 1972 Jahr
1.41 Trln
+103.516 Mlrd.
7.92%
1 Jan 1973 Jahr
1.518 Trln
+108.262 Mlrd.
7.68%
1 Jan 1974 Jahr
1.657 Trln
+138.958 Mlrd.
9.15%
1 Jan 1975 Jahr
1.682 Trln
+24.695 Mlrd.
1.49%
1 Jan 1976 Jahr
1.788 Trln
+106.035 Mlrd.
6.31%
1 Jan 1977 Jahr
1.902 Trln
+114.323 Mlrd.
6.39%
1 Jan 1978 Jahr
2.0 Trln
+98.462 Mlrd.
5.18%
1 Jan 1979 Jahr
2.082 Trln
+81.236 Mlrd.
4.06%
1 Jan 1980 Jahr
2.214 Trln
+132.717 Mlrd.
6.38%
1 Jan 1981 Jahr
2.402 Trln
+187.969 Mlrd.
8.49%
1 Jan 1982 Jahr
2.414 Trln
+11.311 Mlrd.
0.47%
1 Jan 1983 Jahr
2.361 Trln
-52.374 Mlrd.
-2.17%
1 Jan 1984 Jahr
2.249 Trln
-112.509 Mlrd.
-4.76%
1 Jan 1985 Jahr
2.324 Trln
+74.675 Mlrd.
3.32%
1 Jan 1986 Jahr
2.413 Trln
+89.685 Mlrd.
3.86%
1 Jan 1987 Jahr
2.528 Trln
+115.228 Mlrd.
4.77%
1 Jan 1988 Jahr
2.616 Trln
+87.169 Mlrd.
3.45%
1 Jan 1989 Jahr
2.629 Trln
+13.04 Mlrd.
0.5%
1 Jan 1990 Jahr
2.647 Trln
+18.765 Mlrd.
0.71%
1 Jan 1991 Jahr
2.644 Trln
-3.178 Mlrd.
-0.12%
1 Jan 1992 Jahr
2.759 Trln
+114.698 Mlrd.
4.34%
1 Jan 1993 Jahr
2.867 Trln
+108.332 Mlrd.
3.93%
1 Jan 1994 Jahr
2.948 Trln
+81.167 Mlrd.
2.83%
1 Jan 1995 Jahr
3.093 Trln
+144.811 Mlrd.
4.91%
1 Jan 1996 Jahr
3.118 Trln
+25.117 Mlrd.
0.81%
1 Jan 1997 Jahr
3.226 Trln
+107.793 Mlrd.
3.46%
1 Jan 1998 Jahr
3.481 Trln
+254.582 Mlrd.
7.89%
1 Jan 1999 Jahr
3.556 Trln
+74.849 Mlrd.
2.15%
1 Jan 2000 Jahr
3.528 Trln
-27.129 Mlrd.
-0.76%
1 Jan 2001 Jahr
3.672 Trln
+143.817 Mlrd.
4.08%
1 Jan 2002 Jahr
3.706 Trln
+34.018 Mlrd.
0.93%
1 Jan 2003 Jahr
3.672 Trln
-33.787 Mlrd.
-0.91%
1 Jan 2004 Jahr
3.726 Trln
+53.513 Mlrd.
1.46%
1 Jan 2005 Jahr
3.956 Trln
+230.139 Mlrd.
6.18%
1 Jan 2006 Jahr
4.153 Trln
+196.473 Mlrd.
4.97%
1 Jan 2007 Jahr
4.435 Trln
+282.847 Mlrd.
6.81%
1 Jan 2008 Jahr
4.776 Trln
+340.291 Mlrd.
7.67%
1 Jan 2009 Jahr
5.047 Trln
+271.313 Mlrd.
5.68%
1 Jan 2010 Jahr
4.911 Trln
-136.302 Mlrd.
-2.7%
1 Jan 2011 Jahr
5.302 Trln
+391.609 Mlrd.
7.97%
1 Jan 2012 Jahr
5.588 Trln
+285.888 Mlrd.
5.39%
1 Jan 2013 Jahr
5.777 Trln
+188.95 Mlrd.
3.38%
1 Jan 2014 Jahr
5.955 Trln
+177.331 Mlrd.
3.07%
1 Jan 2015 Jahr
5.982 Trln
+26.968 Mlrd.
0.45%
1 Jan 2016 Jahr
5.891 Trln
-90.805 Mlrd.
-1.52%
Bewertung der Länder gemäß mit laufender Statistik nach Jahren


Kommentare: