29
/de/
de
AIzaSyAYiBZKx7MnpbEhh9jyipgxe19OcubqV5w
April 1, 2024
275755
United Kingdom
GBR
true
2
1
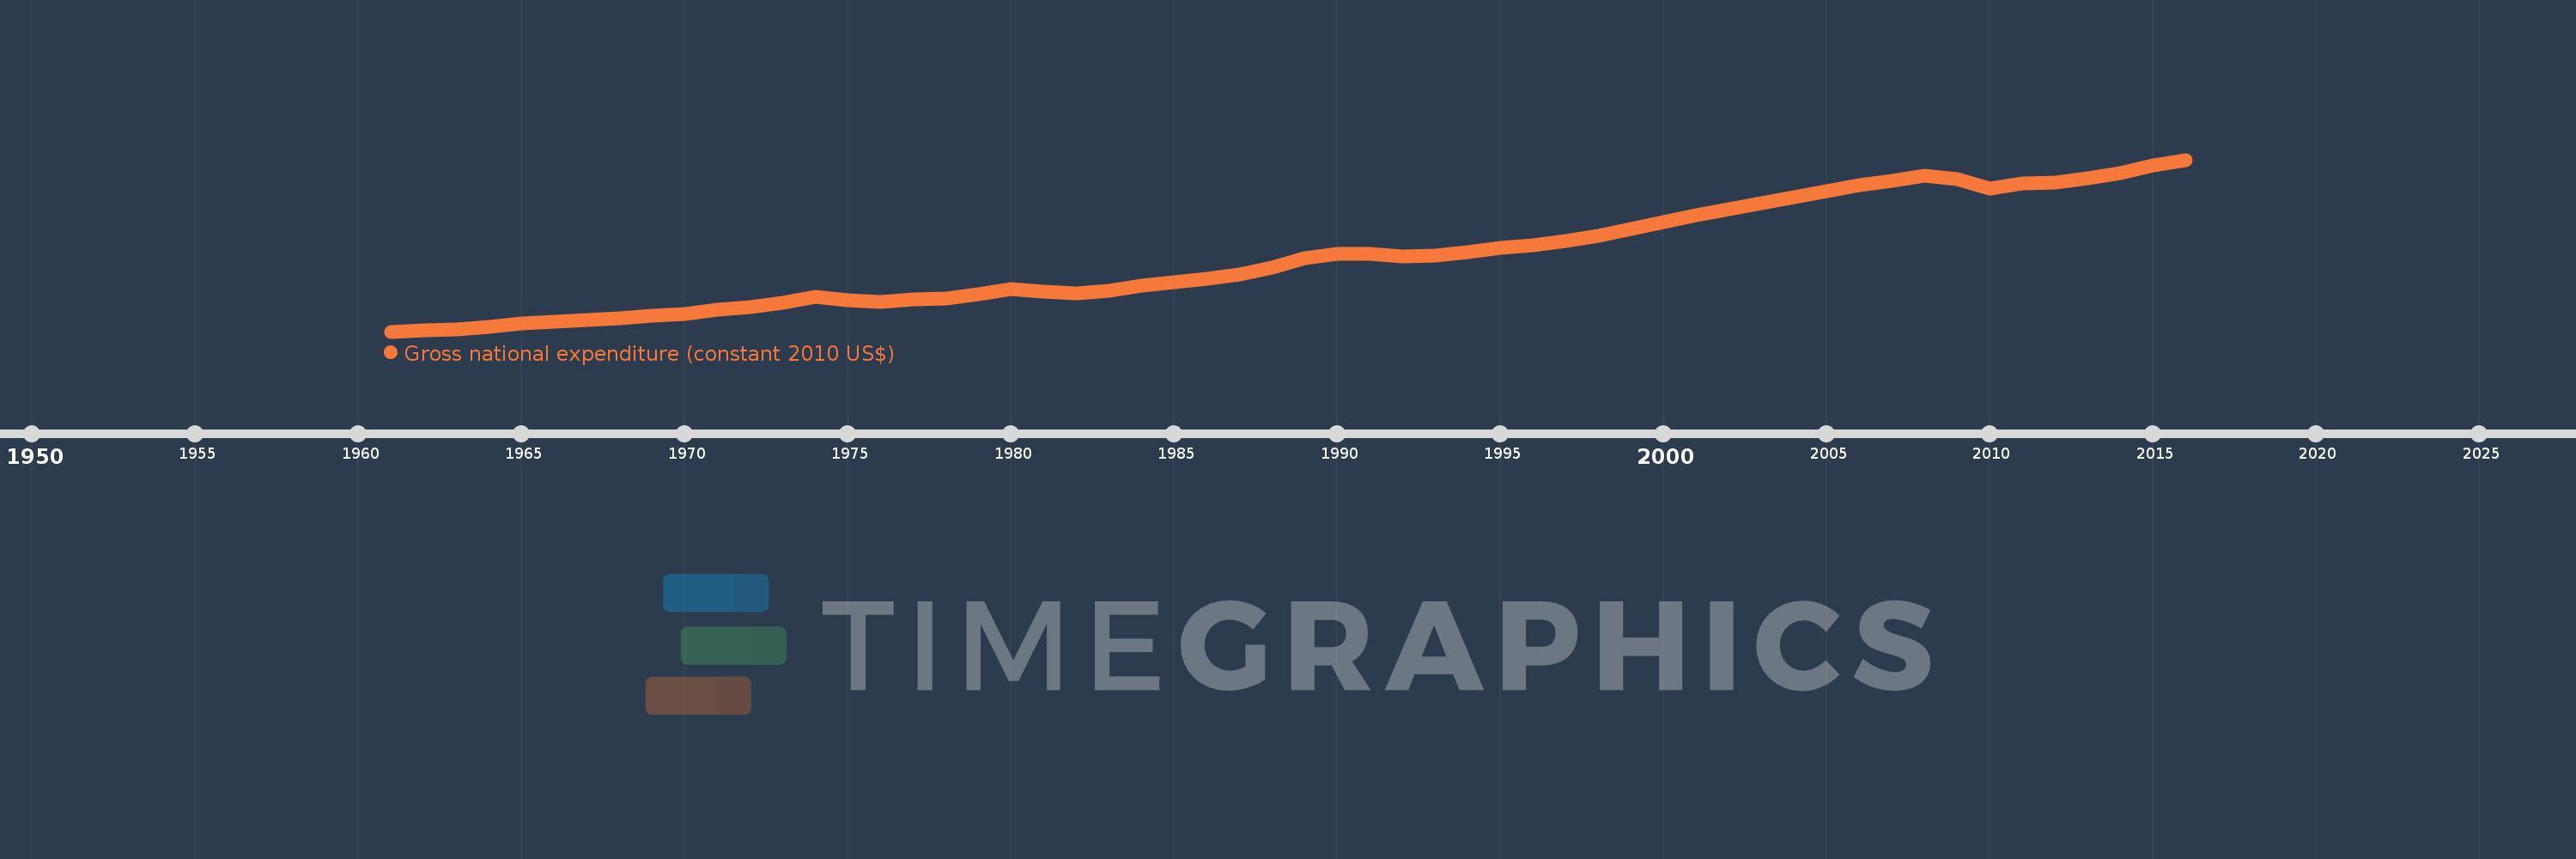
Gross national expenditure (constant 2010 US$)
2016,2015,2014,2013,2012,2011,2010,2009,2008,2007,2006,2005,2004,2003,2002,2001,2000,1999,1998,1997,1996,1995,1994,1993,1992,1991,1990,1989,1988,1987,1986,1985,1984,1983,1982,1981,1980,1979,1978,1977,1976,1975,1974,1973,1972,1971,1970,1969,1968,1967,1966,1965,1964,1963,1962,1961
Diese Statistik in anderen Ländern:
AfghanistanAlbaniaAlgeriaAngolaAntigua and BarbudaArab WorldArgentinaArmeniaArubaAustraliaAustriaAzerbaijanBahamas, TheBahrainBangladeshBarbadosBelarusBelgiumBelizeBeninBermudaBhutanBoliviaBosnia and HerzegovinaBotswanaBrazilBrunei DarussalamBulgariaBurkina FasoBurundiCabo VerdeCambodiaCameroonCanadaCaribbean small statesCentral African RepublicCentral Europe and the BalticsChadChileChinaColombiaComorosCongo, Dem. Rep.Congo, Rep.Costa RicaCote d'IvoireCroatiaCubaCyprusCzech RepublicDenmarkDominicaDominican RepublicEarly-demographic dividendEast Asia & PacificEast Asia & Pacific (excluding high income)East Asia & Pacific (IDA & IBRD countries)EcuadorEgypt, Arab Rep.El SalvadorEquatorial GuineaEritreaEstoniaEuro areaEurope & Central AsiaEurope & Central Asia (excluding high income)Europe & Central Asia (IDA & IBRD countries)European UnionFaroe IslandsFijiFinlandFragile and conflict affected situationsFranceGabonGambia, TheGeorgiaGermanyGhanaGreeceGrenadaGuatemalaGuineaGuinea-BissauGuyanaHaitiHeavily indebted poor countries (HIPC)High incomeHondurasHong Kong SAR, ChinaHungaryIBRD onlyIcelandIDA & IBRD totalIDA blendIDA onlyIDA totalIndiaIndonesiaIran, Islamic Rep.IraqIrelandIsraelItalyJamaicaJapanJordanKazakhstanKenyaKiribatiKorea, Rep.KosovoKuwaitKyrgyz RepublicLao PDRLate-demographic dividendLatin America & Caribbean Latin America & Caribbean (excluding high income)Latin America & the Caribbean (IDA & IBRD countries)LatviaLeast developed countries: UN classificationLebanonLiberiaLibyaLithuaniaLow & middle incomeLow incomeLower middle incomeLuxembourgMacao SAR, ChinaMacedonia, FYRMadagascarMalawiMalaysiaMaldivesMaliMaltaMauritaniaMauritiusMexicoMiddle East & North AfricaMiddle East & North Africa (excluding high income)Middle East & North Africa (IDA & IBRD countries)Middle incomeMoldovaMongoliaMontenegroMoroccoMozambiqueMyanmarNamibiaNepalNetherlandsNew ZealandNicaraguaNigerNigeriaNorth AmericaNorwayOECD membersOmanOther small statesPacific island small statesPakistanPalauPanamaParaguayPeruPhilippinesPolandPortugalPost-demographic dividendPre-demographic dividendPuerto RicoQatarRomaniaRussian FederationRwandaSamoaSaudi ArabiaSenegalSerbiaSeychellesSierra LeoneSingaporeSlovak RepublicSloveniaSmall statesSolomon IslandsSouth AfricaSouth AsiaSouth Asia (IDA & IBRD)South SudanSpainSri LankaSt. Kitts and NevisSt. LuciaSt. Vincent and the GrenadinesSub-Saharan Africa Sub-Saharan Africa (excluding high income)Sub-Saharan Africa (IDA & IBRD countries)SudanSurinameSwazilandSwedenSwitzerlandTajikistanTanzaniaThailandTimor-LesteTogoTongaTrinidad and TobagoTunisiaTurkeyTurkmenistanUgandaUkraineUnited Arab EmiratesUnited KingdomUnited StatesUpper middle incomeUruguayUzbekistanVanuatuVenezuela, RBVietnamWest Bank and GazaWorldYemen, Rep.ZambiaZimbabwe Zeitlinie:
Diese Zeitleiste vorliegt die Graphik ab 1961 J. bis 2016 J. United Kingdom. Die Angaben bis 1960 J. sind nicht vorhanden. Die Zahl aktueller Beobachtungen nach Daten: 56.
Die Quelle (Bezeichnung):
Kennzahlen der Weltentwicklung
Die Quelle (Einrichtung):
World Bank national accounts data, and OECD National Accounts data files.
Kategorien:
Economy & Growth
Es wurde aktualisiert:
23 Apr 2017 Jahr
Kennzahlen der Wertänderungen vom Jahr zum Jahr
im Durchschnitt:
1.611 Trln
Minimum:
728.025 Mlrd.
1 Jan 1961 Jahr
Maximum:
2.772 Trln
1 Jan 2016 Jahr
Zum Datum der Beobachtung
Wert
Absolute Veränderung
Die Veränderung bezüglich dem vorherigen Wert
1 Jan 1961 Jahr
728.025 Mlrd.
+728.025 Mlrd.
0.0%
1 Jan 1962 Jahr
743.905 Mlrd.
+15.88 Mlrd.
2.18%
1 Jan 1963 Jahr
754.128 Mlrd.
+10.223 Mlrd.
1.37%
1 Jan 1964 Jahr
783.458 Mlrd.
+29.33 Mlrd.
3.89%
1 Jan 1965 Jahr
828.395 Mlrd.
+44.937 Mlrd.
5.74%
1 Jan 1966 Jahr
848.766 Mlrd.
+20.371 Mlrd.
2.46%
1 Jan 1967 Jahr
863.811 Mlrd.
+15.045 Mlrd.
1.77%
1 Jan 1968 Jahr
889.307 Mlrd.
+25.496 Mlrd.
2.95%
1 Jan 1969 Jahr
920.58 Mlrd.
+31.273 Mlrd.
3.52%
1 Jan 1970 Jahr
933.003 Mlrd.
+12.423 Mlrd.
1.35%
1 Jan 1971 Jahr
986.76 Mlrd.
+53.757 Mlrd.
5.76%
1 Jan 1972 Jahr
1.019 Trln
+32.102 Mlrd.
3.25%
1 Jan 1973 Jahr
1.075 Trln
+55.843 Mlrd.
5.48%
1 Jan 1974 Jahr
1.143 Trln
+68.428 Mlrd.
6.37%
1 Jan 1975 Jahr
1.105 Trln
-38.59 Mlrd.
-3.38%
1 Jan 1976 Jahr
1.082 Trln
-22.219 Mlrd.
-2.01%
1 Jan 1977 Jahr
1.107 Trln
+24.54 Mlrd.
2.27%
1 Jan 1978 Jahr
1.125 Trln
+18.211 Mlrd.
1.65%
1 Jan 1979 Jahr
1.176 Trln
+51.087 Mlrd.
4.54%
1 Jan 1980 Jahr
1.23 Trln
+53.916 Mlrd.
4.58%
1 Jan 1981 Jahr
1.199 Trln
-31.518 Mlrd.
-2.56%
1 Jan 1982 Jahr
1.185 Trln
-13.453 Mlrd.
-1.12%
1 Jan 1983 Jahr
1.216 Trln
+30.865 Mlrd.
2.6%
1 Jan 1984 Jahr
1.276 Trln
+60.263 Mlrd.
4.96%
1 Jan 1985 Jahr
1.311 Trln
+34.335 Mlrd.
2.69%
1 Jan 1986 Jahr
1.358 Trln
+47.479 Mlrd.
3.62%
1 Jan 1987 Jahr
1.407 Trln
+48.575 Mlrd.
3.58%
1 Jan 1988 Jahr
1.487 Trln
+80.081 Mlrd.
5.69%
1 Jan 1989 Jahr
1.604 Trln
+117.676 Mlrd.
7.92%
1 Jan 1990 Jahr
1.654 Trln
+50.011 Mlrd.
3.12%
1 Jan 1991 Jahr
1.653 Trln
-1.43 Mlrd.
-0.09%
1 Jan 1992 Jahr
1.621 Trln
-32.379 Mlrd.
-1.96%
1 Jan 1993 Jahr
1.633 Trln
+12.501 Mlrd.
0.77%
1 Jan 1994 Jahr
1.67 Trln
+37.19 Mlrd.
2.28%
1 Jan 1995 Jahr
1.725 Trln
+54.296 Mlrd.
3.25%
1 Jan 1996 Jahr
1.754 Trln
+29.21 Mlrd.
1.69%
1 Jan 1997 Jahr
1.805 Trln
+51.471 Mlrd.
2.93%
1 Jan 1998 Jahr
1.863 Trln
+57.36 Mlrd.
3.18%
1 Jan 1999 Jahr
1.948 Trln
+85.122 Mlrd.
4.57%
1 Jan 2000 Jahr
2.033 Trln
+85.322 Mlrd.
4.38%
1 Jan 2001 Jahr
2.111 Trln
+78.02 Mlrd.
3.84%
1 Jan 2002 Jahr
2.183 Trln
+72.232 Mlrd.
3.42%
1 Jan 2003 Jahr
2.254 Trln
+70.304 Mlrd.
3.22%
1 Jan 2004 Jahr
2.331 Trln
+77.565 Mlrd.
3.44%
1 Jan 2005 Jahr
2.402 Trln
+70.657 Mlrd.
3.03%
1 Jan 2006 Jahr
2.467 Trln
+65.648 Mlrd.
2.73%
1 Jan 2007 Jahr
2.52 Trln
+52.711 Mlrd.
2.14%
1 Jan 2008 Jahr
2.584 Trln
+63.911 Mlrd.
2.54%
1 Jan 2009 Jahr
2.546 Trln
-37.851 Mlrd.
-1.46%
1 Jan 2010 Jahr
2.431 Trln
-115.627 Mlrd.
-4.54%
1 Jan 2011 Jahr
2.495 Trln
+64.791 Mlrd.
2.67%
1 Jan 2012 Jahr
2.498 Trln
+2.934 Mlrd.
0.12%
1 Jan 2013 Jahr
2.548 Trln
+49.628 Mlrd.
1.99%
1 Jan 2014 Jahr
2.615 Trln
+66.583 Mlrd.
2.61%
1 Jan 2015 Jahr
2.702 Trln
+87.878 Mlrd.
3.36%
1 Jan 2016 Jahr
2.772 Trln
+69.126 Mlrd.
2.56%
Bewertung der Länder gemäß mit laufender Statistik nach Jahren


Kommentare: