29
/de/
de
AIzaSyAYiBZKx7MnpbEhh9jyipgxe19OcubqV5w
April 1, 2024
40619
Late-demographic dividend
LTE
false
2
1
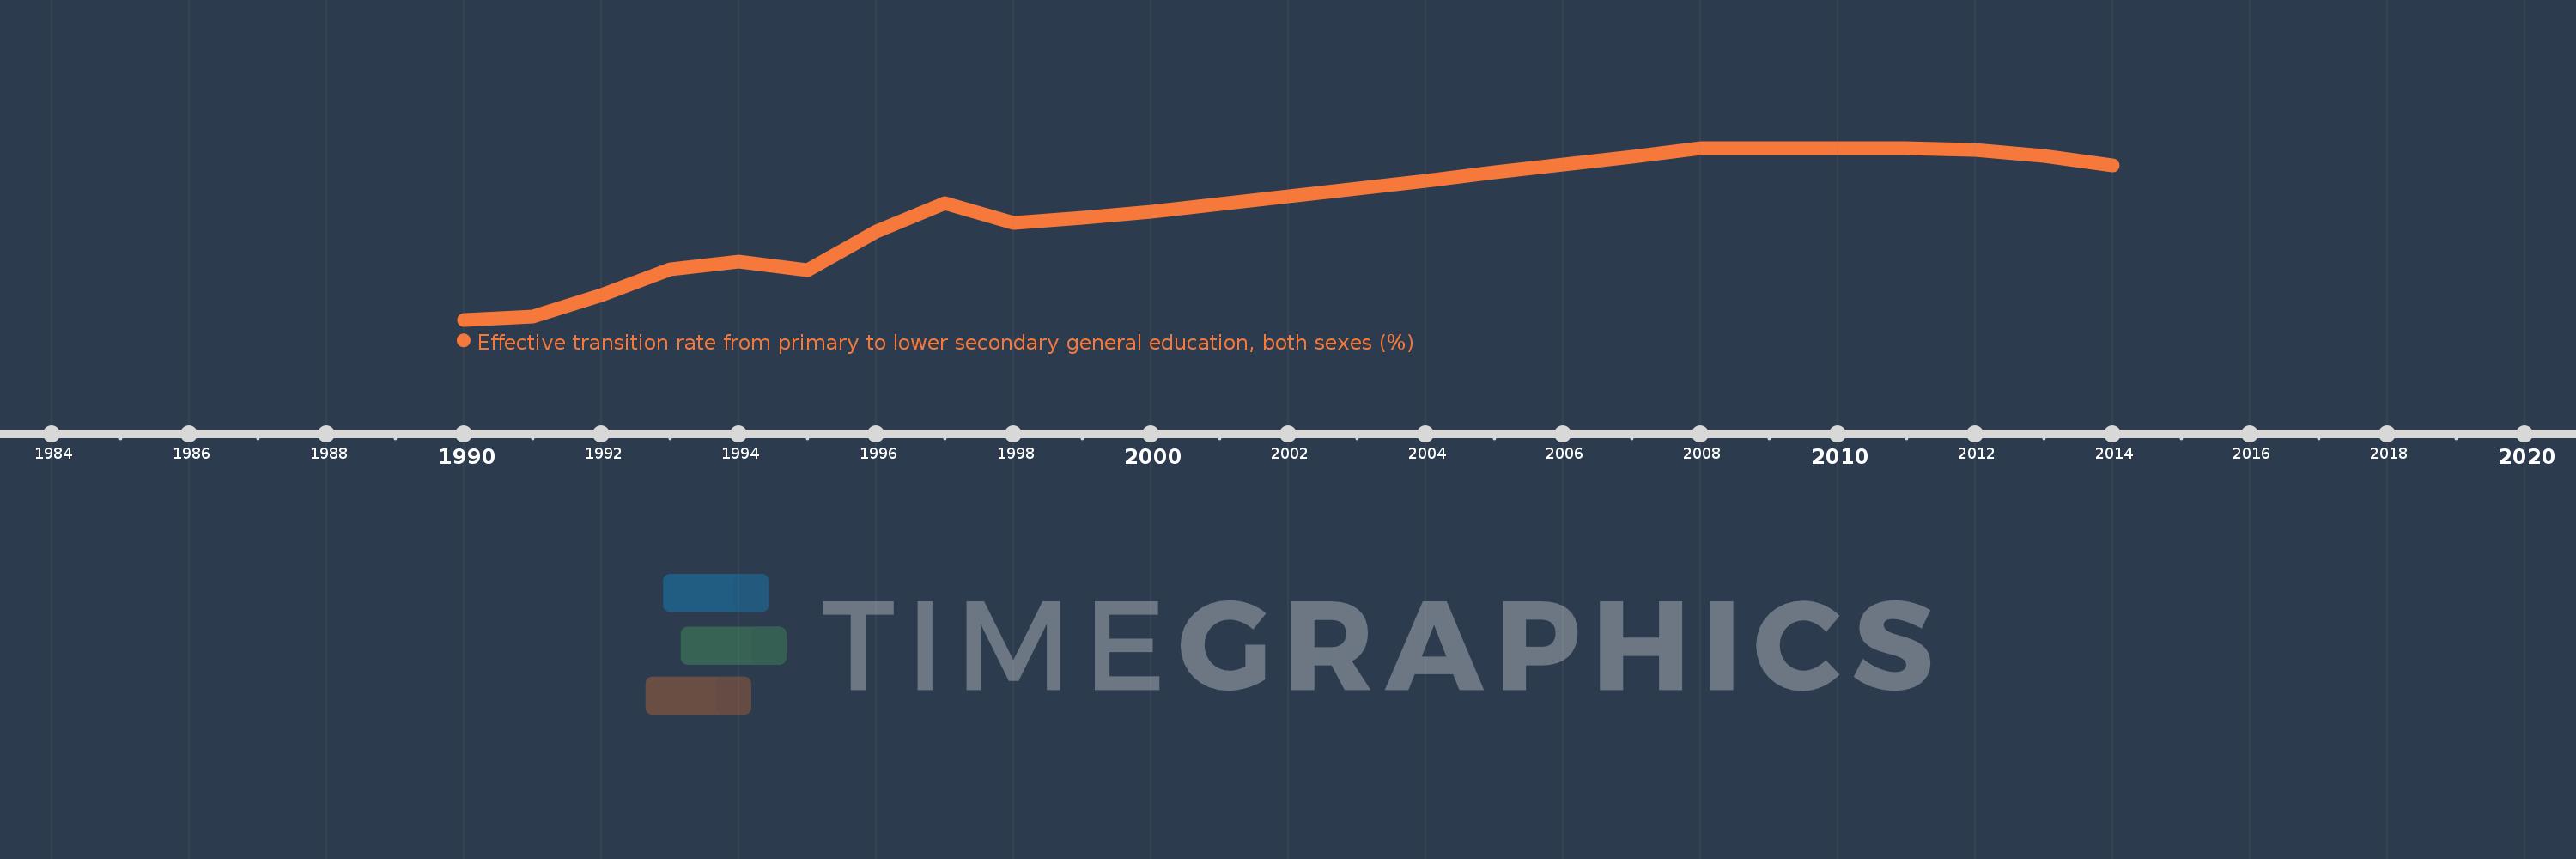
Effective transition rate from primary to lower secondary general education, both sexes (%)
2014,2013,2012,2011,2010,2009,2008,2007,2006,2005,2004,2003,2002,2001,2000,1999,1998,1997,1996,1995,1994,1993,1992,1991,1990
Diese Statistik in anderen Ländern:
AfghanistanAlbaniaAlgeriaAngolaAntigua and BarbudaArab WorldArgentinaArmeniaArubaAustriaAzerbaijanBahamas, TheBahrainBangladeshBarbadosBelarusBelgiumBelizeBeninBermudaBhutanBoliviaBosnia and HerzegovinaBotswanaBrazilBritish Virgin IslandsBrunei DarussalamBulgariaBurkina FasoBurundiCabo VerdeCambodiaCameroonCaribbean small statesCayman IslandsCentral African RepublicCentral Europe and the BalticsChadChileChinaColombiaComorosCongo, Dem. Rep.Congo, Rep.Costa RicaCote d'IvoireCroatiaCubaCyprusCzech RepublicDenmarkDjiboutiDominicaDominican RepublicEarly-demographic dividendEast Asia & PacificEast Asia & Pacific (excluding high income)East Asia & Pacific (IDA & IBRD countries)EcuadorEgypt, Arab Rep.El SalvadorEquatorial GuineaEritreaEstoniaEthiopiaEuro areaEurope & Central AsiaEurope & Central Asia (excluding high income)Europe & Central Asia (IDA & IBRD countries)European UnionFijiFinlandFragile and conflict affected situationsFranceGabonGambia, TheGeorgiaGermanyGhanaGreeceGrenadaGuatemalaGuineaGuinea-BissauGuyanaHaitiHeavily indebted poor countries (HIPC)High incomeHondurasHong Kong SAR, ChinaHungaryIBRD onlyIcelandIDA & IBRD totalIDA blendIDA onlyIDA totalIndiaIndonesiaIran, Islamic Rep.IraqIsraelItalyJamaicaJapanJordanKazakhstanKenyaKiribatiKorea, Rep.KuwaitKyrgyz RepublicLao PDRLate-demographic dividendLatin America & Caribbean Latin America & Caribbean (excluding high income)Latin America & the Caribbean (IDA & IBRD countries)LatviaLeast developed countries: UN classificationLebanonLesothoLiberiaLibyaLiechtensteinLithuaniaLow & middle incomeLow incomeLower middle incomeLuxembourgMacao SAR, ChinaMacedonia, FYRMadagascarMalawiMalaysiaMaldivesMaliMaltaMarshall IslandsMauritaniaMauritiusMexicoMiddle East & North AfricaMiddle East & North Africa (excluding high income)Middle East & North Africa (IDA & IBRD countries)Middle incomeMoldovaMonacoMongoliaMoroccoMozambiqueMyanmarNamibiaNepalNetherlandsNicaraguaNigerNorwayOECD membersOmanOther small statesPacific island small statesPakistanPalauPanamaParaguayPeruPhilippinesPolandPortugalPost-demographic dividendPre-demographic dividendQatarRomaniaRussian FederationRwandaSamoaSan MarinoSao Tome and PrincipeSaudi ArabiaSenegalSerbiaSeychellesSierra LeoneSingaporeSlovak RepublicSloveniaSmall statesSolomon IslandsSouth AfricaSouth AsiaSouth Asia (IDA & IBRD)SpainSri LankaSt. Kitts and NevisSt. LuciaSt. Vincent and the GrenadinesSub-Saharan Africa Sub-Saharan Africa (excluding high income)Sub-Saharan Africa (IDA & IBRD countries)SudanSurinameSwazilandSwedenSwitzerlandSyrian Arab RepublicTajikistanTanzaniaThailandTimor-LesteTogoTongaTrinidad and TobagoTunisiaTurkeyTurks and Caicos IslandsTuvaluUgandaUkraineUnited Arab EmiratesUpper middle incomeUruguayUzbekistanVanuatuVenezuela, RBVietnamWest Bank and GazaWorldYemen, Rep.ZambiaZimbabwe Zeitlinie:
Diese Zeitleiste vorliegt die Graphik ab 1990 J. bis 2014 J. Late-demographic dividend. Die Angaben bis 1989 J. sind nicht vorhanden. Die Zahl aktueller Beobachtungen nach Daten: 25.
Die Quelle (Bezeichnung):
Kennzahlen der Weltentwicklung
Die Quelle (Einrichtung):
UNESCO Institute for Statistics
Kategorien:
Education
Es wurde aktualisiert:
23 Apr 2017 Jahr
Kennzahlen der Wertänderungen vom Jahr zum Jahr
Minimum:
75.668
1 Jan 1990 Jahr
Maximum:
98.051
1 Jan 2009 Jahr
Zum Datum der Beobachtung
Wert
Absolute Veränderung
Die Veränderung bezüglich dem vorherigen Wert
1 Jan 1990 Jahr
75.668
+75.668
0.0%
1 Jan 1991 Jahr
76.119
+0.451
0.6%
1 Jan 1992 Jahr
78.863
+2.743
3.6%
1 Jan 1993 Jahr
82.269
+3.406
4.32%
1 Jan 1994 Jahr
83.222
+0.953
1.16%
1 Jan 1995 Jahr
82.077
-1.145
-1.38%
1 Jan 1996 Jahr
87.11
+5.033
6.13%
1 Jan 1997 Jahr
90.871
+3.761
4.32%
1 Jan 1998 Jahr
88.251
-2.619
-2.88%
1 Jan 1999 Jahr
88.909
+0.657
0.74%
1 Jan 2000 Jahr
89.777
+0.868
0.98%
1 Jan 2001 Jahr
90.723
+0.946
1.05%
1 Jan 2002 Jahr
91.727
+1.004
1.11%
1 Jan 2003 Jahr
92.8
+1.073
1.17%
1 Jan 2004 Jahr
93.766
+0.967
1.04%
1 Jan 2005 Jahr
94.862
+1.096
1.17%
1 Jan 2006 Jahr
95.881
+1.019
1.07%
1 Jan 2007 Jahr
96.934
+1.053
1.1%
1 Jan 2008 Jahr
97.981
+1.047
1.08%
1 Jan 2009 Jahr
98.051
+0.07
0.07%
1 Jan 2010 Jahr
98.034
-0.018
-0.02%
1 Jan 2011 Jahr
98.034
+0.001
0.0%
1 Jan 2012 Jahr
97.757
-0.277
-0.28%
1 Jan 2013 Jahr
97.006
-0.751
-0.77%
1 Jan 2014 Jahr
95.788
-1.218
-1.26%
Bewertung der Länder gemäß mit laufender Statistik nach Jahren


Kommentare: