29
/de/
de
AIzaSyAYiBZKx7MnpbEhh9jyipgxe19OcubqV5w
April 1, 2024
238168
Seychelles
SYC
true
2
1
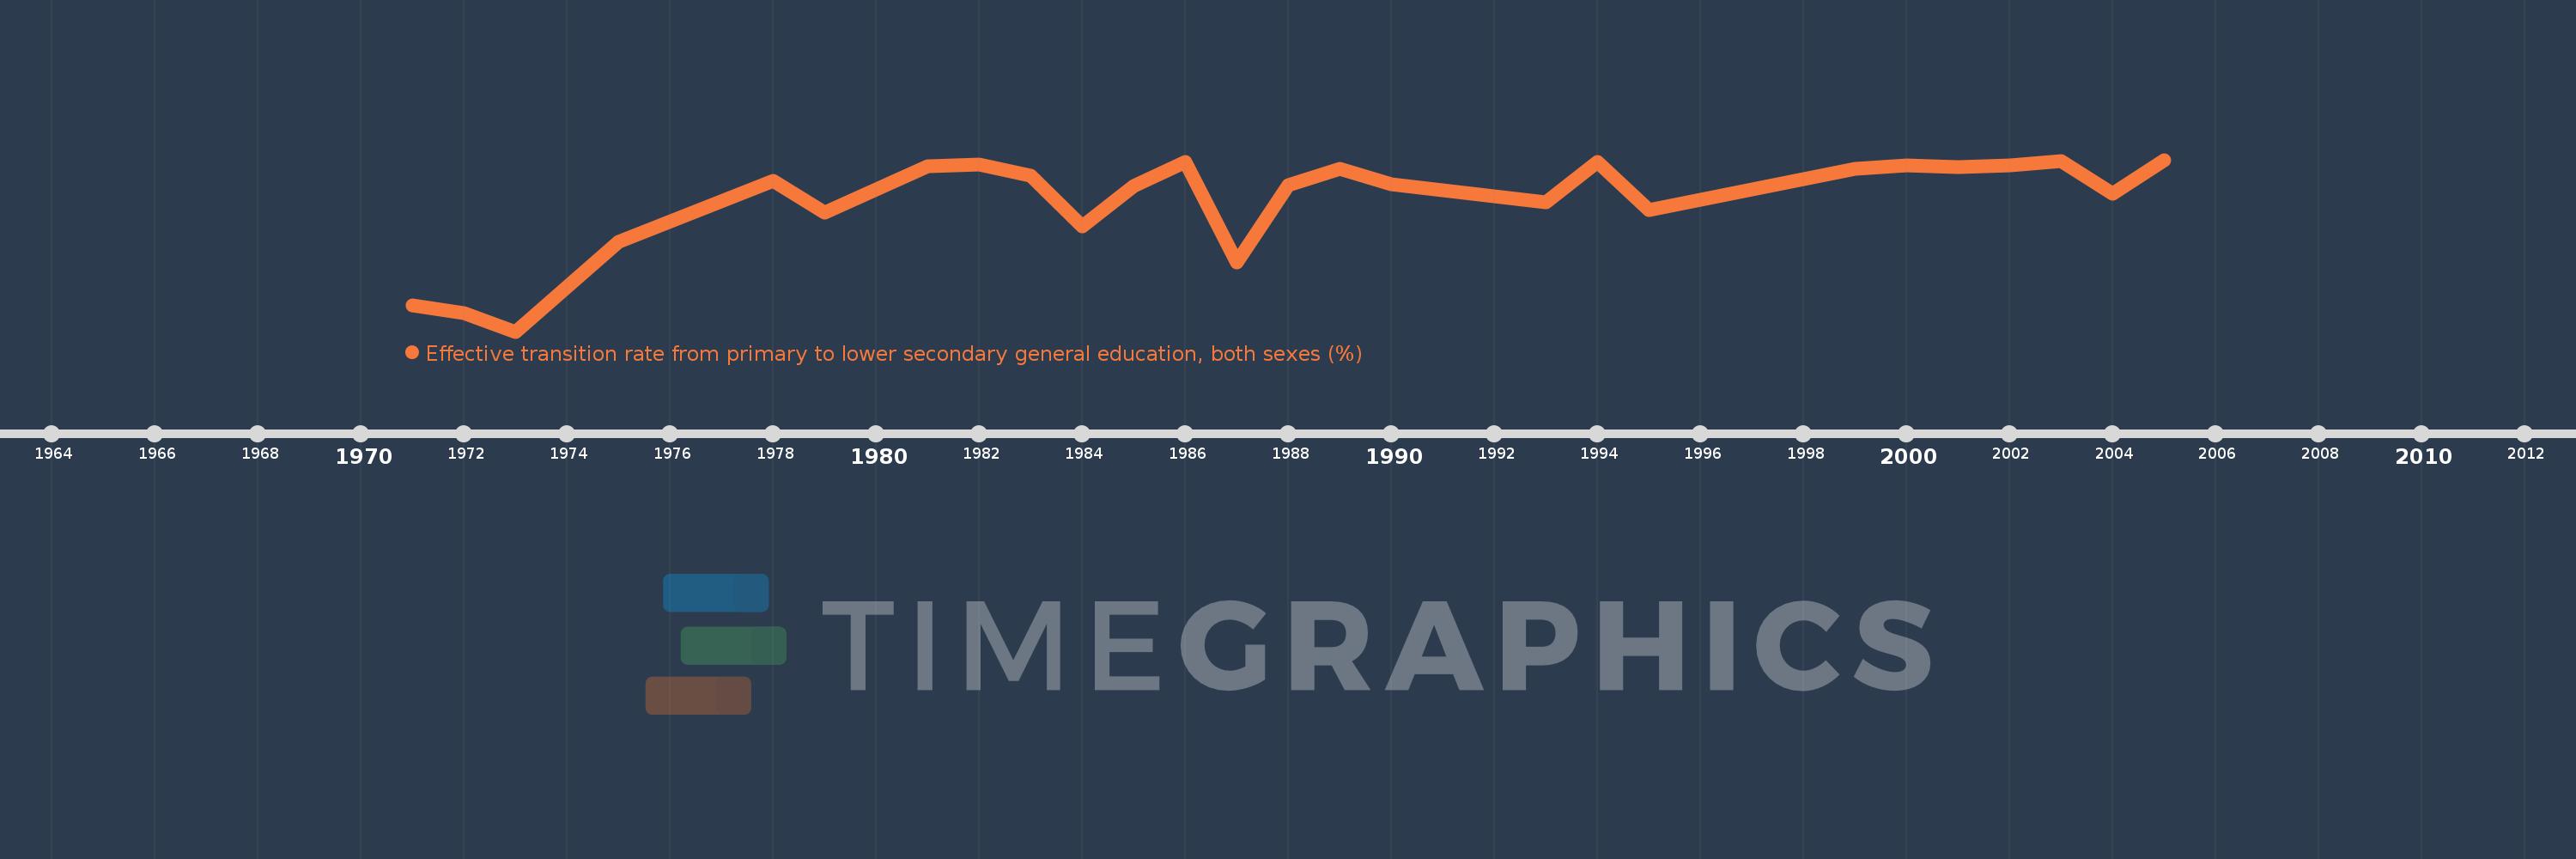
Effective transition rate from primary to lower secondary general education, both sexes (%)
2005,2004,2003,2002,2001,2000,1999,1995,1994,1993,1990,1989,1988,1987,1986,1985,1984,1983,1982,1981,1979,1978,1975,1973,1972,1971
Diese Statistik in anderen Ländern:
AfghanistanAlbaniaAlgeriaAngolaAntigua and BarbudaArab WorldArgentinaArmeniaArubaAustriaAzerbaijanBahamas, TheBahrainBangladeshBarbadosBelarusBelgiumBelizeBeninBermudaBhutanBoliviaBosnia and HerzegovinaBotswanaBrazilBritish Virgin IslandsBrunei DarussalamBulgariaBurkina FasoBurundiCabo VerdeCambodiaCameroonCaribbean small statesCayman IslandsCentral African RepublicCentral Europe and the BalticsChadChileChinaColombiaComorosCongo, Dem. Rep.Congo, Rep.Costa RicaCote d'IvoireCroatiaCubaCyprusCzech RepublicDenmarkDjiboutiDominicaDominican RepublicEarly-demographic dividendEast Asia & PacificEast Asia & Pacific (excluding high income)East Asia & Pacific (IDA & IBRD countries)EcuadorEgypt, Arab Rep.El SalvadorEquatorial GuineaEritreaEstoniaEthiopiaEuro areaEurope & Central AsiaEurope & Central Asia (excluding high income)Europe & Central Asia (IDA & IBRD countries)European UnionFijiFinlandFragile and conflict affected situationsFranceGabonGambia, TheGeorgiaGermanyGhanaGreeceGrenadaGuatemalaGuineaGuinea-BissauGuyanaHaitiHeavily indebted poor countries (HIPC)High incomeHondurasHong Kong SAR, ChinaHungaryIBRD onlyIcelandIDA & IBRD totalIDA blendIDA onlyIDA totalIndiaIndonesiaIran, Islamic Rep.IraqIsraelItalyJamaicaJapanJordanKazakhstanKenyaKiribatiKorea, Rep.KuwaitKyrgyz RepublicLao PDRLate-demographic dividendLatin America & Caribbean Latin America & Caribbean (excluding high income)Latin America & the Caribbean (IDA & IBRD countries)LatviaLeast developed countries: UN classificationLebanonLesothoLiberiaLibyaLiechtensteinLithuaniaLow & middle incomeLow incomeLower middle incomeLuxembourgMacao SAR, ChinaMacedonia, FYRMadagascarMalawiMalaysiaMaldivesMaliMaltaMarshall IslandsMauritaniaMauritiusMexicoMiddle East & North AfricaMiddle East & North Africa (excluding high income)Middle East & North Africa (IDA & IBRD countries)Middle incomeMoldovaMonacoMongoliaMoroccoMozambiqueMyanmarNamibiaNepalNetherlandsNicaraguaNigerNorwayOECD membersOmanOther small statesPacific island small statesPakistanPalauPanamaParaguayPeruPhilippinesPolandPortugalPost-demographic dividendPre-demographic dividendQatarRomaniaRussian FederationRwandaSamoaSan MarinoSao Tome and PrincipeSaudi ArabiaSenegalSerbiaSeychellesSierra LeoneSingaporeSlovak RepublicSloveniaSmall statesSolomon IslandsSouth AfricaSouth AsiaSouth Asia (IDA & IBRD)SpainSri LankaSt. Kitts and NevisSt. LuciaSt. Vincent and the GrenadinesSub-Saharan Africa Sub-Saharan Africa (excluding high income)Sub-Saharan Africa (IDA & IBRD countries)SudanSurinameSwazilandSwedenSwitzerlandSyrian Arab RepublicTajikistanTanzaniaThailandTimor-LesteTogoTongaTrinidad and TobagoTunisiaTurkeyTurks and Caicos IslandsTuvaluUgandaUkraineUnited Arab EmiratesUpper middle incomeUruguayUzbekistanVanuatuVenezuela, RBVietnamWest Bank and GazaWorldYemen, Rep.ZambiaZimbabwe Zeitlinie:
Diese Zeitleiste vorliegt die Graphik ab 1971 J. bis 2005 J. Seychelles. Die Angaben bis 1970 J. sind nicht vorhanden. Die Zahl aktueller Beobachtungen nach Daten: 26.
Die Quelle (Bezeichnung):
Kennzahlen der Weltentwicklung
Die Quelle (Einrichtung):
UNESCO Institute for Statistics
Kategorien:
Education
Es wurde aktualisiert:
23 Apr 2017 Jahr
Kennzahlen der Wertänderungen vom Jahr zum Jahr
Minimum:
74.225
1 Jan 1973 Jahr
Maximum:
99.892
1 Jan 2005 Jahr
Zum Datum der Beobachtung
Wert
Absolute Veränderung
Die Veränderung bezüglich dem vorherigen Wert
1 Jan 1971 Jahr
78.086
+78.086
0.0%
1 Jan 1972 Jahr
77.035
-1.051
-1.35%
1 Jan 1973 Jahr
74.225
-2.81
-3.65%
1 Jan 1975 Jahr
87.65
+13.425
18.09%
1 Jan 1978 Jahr
96.73
+9.081
10.36%
1 Jan 1979 Jahr
92.012
-4.718
-4.88%
1 Jan 1981 Jahr
98.903
+6.891
7.49%
1 Jan 1982 Jahr
99.233
+0.33
0.33%
1 Jan 1983 Jahr
97.468
-1.765
-1.78%
1 Jan 1984 Jahr
89.934
-7.533
-7.73%
1 Jan 1985 Jahr
95.997
+6.063
6.74%
1 Jan 1986 Jahr
99.529
+3.532
3.68%
1 Jan 1987 Jahr
84.577
-14.952
-15.02%
1 Jan 1988 Jahr
96.169
+11.592
13.71%
1 Jan 1989 Jahr
98.565
+2.396
2.49%
1 Jan 1990 Jahr
96.172
-2.393
-2.43%
1 Jan 1993 Jahr
93.593
-2.578
-2.68%
1 Jan 1994 Jahr
99.514
+5.92
6.33%
1 Jan 1995 Jahr
92.446
-7.068
-7.1%
1 Jan 1999 Jahr
98.595
+6.15
6.65%
1 Jan 2000 Jahr
99.01
+0.414
0.42%
1 Jan 2001 Jahr
98.8
-0.21
-0.21%
1 Jan 2002 Jahr
99.038
+0.238
0.24%
1 Jan 2003 Jahr
99.747
+0.709
0.72%
1 Jan 2004 Jahr
94.875
-4.872
-4.88%
1 Jan 2005 Jahr
99.892
+5.017
5.29%
Bewertung der Länder gemäß mit laufender Statistik nach Jahren


Kommentare: