29
/de/
de
AIzaSyAYiBZKx7MnpbEhh9jyipgxe19OcubqV5w
April 1, 2024
37552
IDA & IBRD total
IBT
false
2
1
Merchandise imports by the reporting economy (current US$)
2015,2014,2013,2012,2011,2010,2009,2008,2007,2006,2005,2004,2003,2002,2001,2000,1999,1998,1997,1996,1995,1994,1993,1992,1991,1990,1989,1988,1987,1986,1985,1984,1983,1982,1981,1980,1979,1978,1977,1976,1975,1974,1973,1972,1971,1970,1969,1968,1967,1966,1965,1964,1963,1962,1961
Diese Statistik in anderen Ländern:
AfghanistanAlbaniaAlgeriaAmerican SamoaAngolaAntigua and BarbudaArab WorldArgentinaArmeniaArubaAustraliaAustriaAzerbaijanBahamas, TheBahrainBangladeshBarbadosBelarusBelgiumBelizeBeninBermudaBoliviaBosnia and HerzegovinaBrazilBrunei DarussalamBulgariaBurkina FasoBurundiCabo VerdeCambodiaCameroonCanadaCaribbean small statesCentral African RepublicCentral Europe and the BalticsChadChileChinaColombiaComorosCongo, Dem. Rep.Congo, Rep.Costa RicaCote d'IvoireCroatiaCubaCyprusCzech RepublicDenmarkDjiboutiDominicaDominican RepublicEarly-demographic dividendEast Asia & PacificEast Asia & Pacific (excluding high income)East Asia & Pacific (IDA & IBRD countries)EcuadorEgypt, Arab Rep.El SalvadorEquatorial GuineaEstoniaEthiopiaEuro areaEurope & Central AsiaEurope & Central Asia (excluding high income)Europe & Central Asia (IDA & IBRD countries)European UnionFaroe IslandsFijiFinlandFragile and conflict affected situationsFranceFrench PolynesiaGabonGambia, TheGeorgiaGermanyGhanaGibraltarGreeceGreenlandGrenadaGuamGuatemalaGuineaGuinea-BissauGuyanaHaitiHeavily indebted poor countries (HIPC)High incomeHondurasHong Kong SAR, ChinaHungaryIBRD onlyIcelandIDA & IBRD totalIDA blendIDA onlyIDA totalIndiaIndonesiaIran, Islamic Rep.IraqIrelandIsraelItalyJamaicaJapanJordanKazakhstanKenyaKiribatiKorea, Dem. People’s Rep.Korea, Rep.KosovoKuwaitKyrgyz RepublicLao PDRLate-demographic dividendLatin America & Caribbean Latin America & Caribbean (excluding high income)Latin America & the Caribbean (IDA & IBRD countries)LatviaLeast developed countries: UN classificationLebanonLiberiaLibyaLithuaniaLow & middle incomeLow incomeLower middle incomeLuxembourgMacao SAR, ChinaMacedonia, FYRMadagascarMalawiMalaysiaMaldivesMaliMaltaMauritaniaMauritiusMexicoMiddle East & North AfricaMiddle East & North Africa (excluding high income)Middle East & North Africa (IDA & IBRD countries)Middle incomeMoldovaMongoliaMontenegroMoroccoMozambiqueMyanmarNauruNepalNetherlandsNew CaledoniaNew ZealandNicaraguaNigerNigeriaNorth AmericaNorwayOECD membersOmanOther small statesPacific island small statesPakistanPanamaPapua New GuineaParaguayPeruPhilippinesPolandPortugalPost-demographic dividendPre-demographic dividendQatarRomaniaRussian FederationRwandaSamoaSao Tome and PrincipeSaudi ArabiaSenegalSerbiaSeychellesSierra LeoneSingaporeSlovak RepublicSloveniaSmall statesSolomon IslandsSomaliaSouth AfricaSouth AsiaSouth Asia (IDA & IBRD)SpainSri LankaSt. Kitts and NevisSt. LuciaSt. Vincent and the GrenadinesSub-Saharan Africa Sub-Saharan Africa (excluding high income)Sub-Saharan Africa (IDA & IBRD countries)SudanSurinameSwedenSwitzerlandSyrian Arab RepublicTajikistanTanzaniaThailandTogoTongaTrinidad and TobagoTunisiaTurkeyTurkmenistanTuvaluUgandaUkraineUnited Arab EmiratesUnited KingdomUnited StatesUpper middle incomeUruguayUzbekistanVanuatuVenezuela, RBVietnamWorldYemen, Rep.ZambiaZimbabwe Zeitlinie:
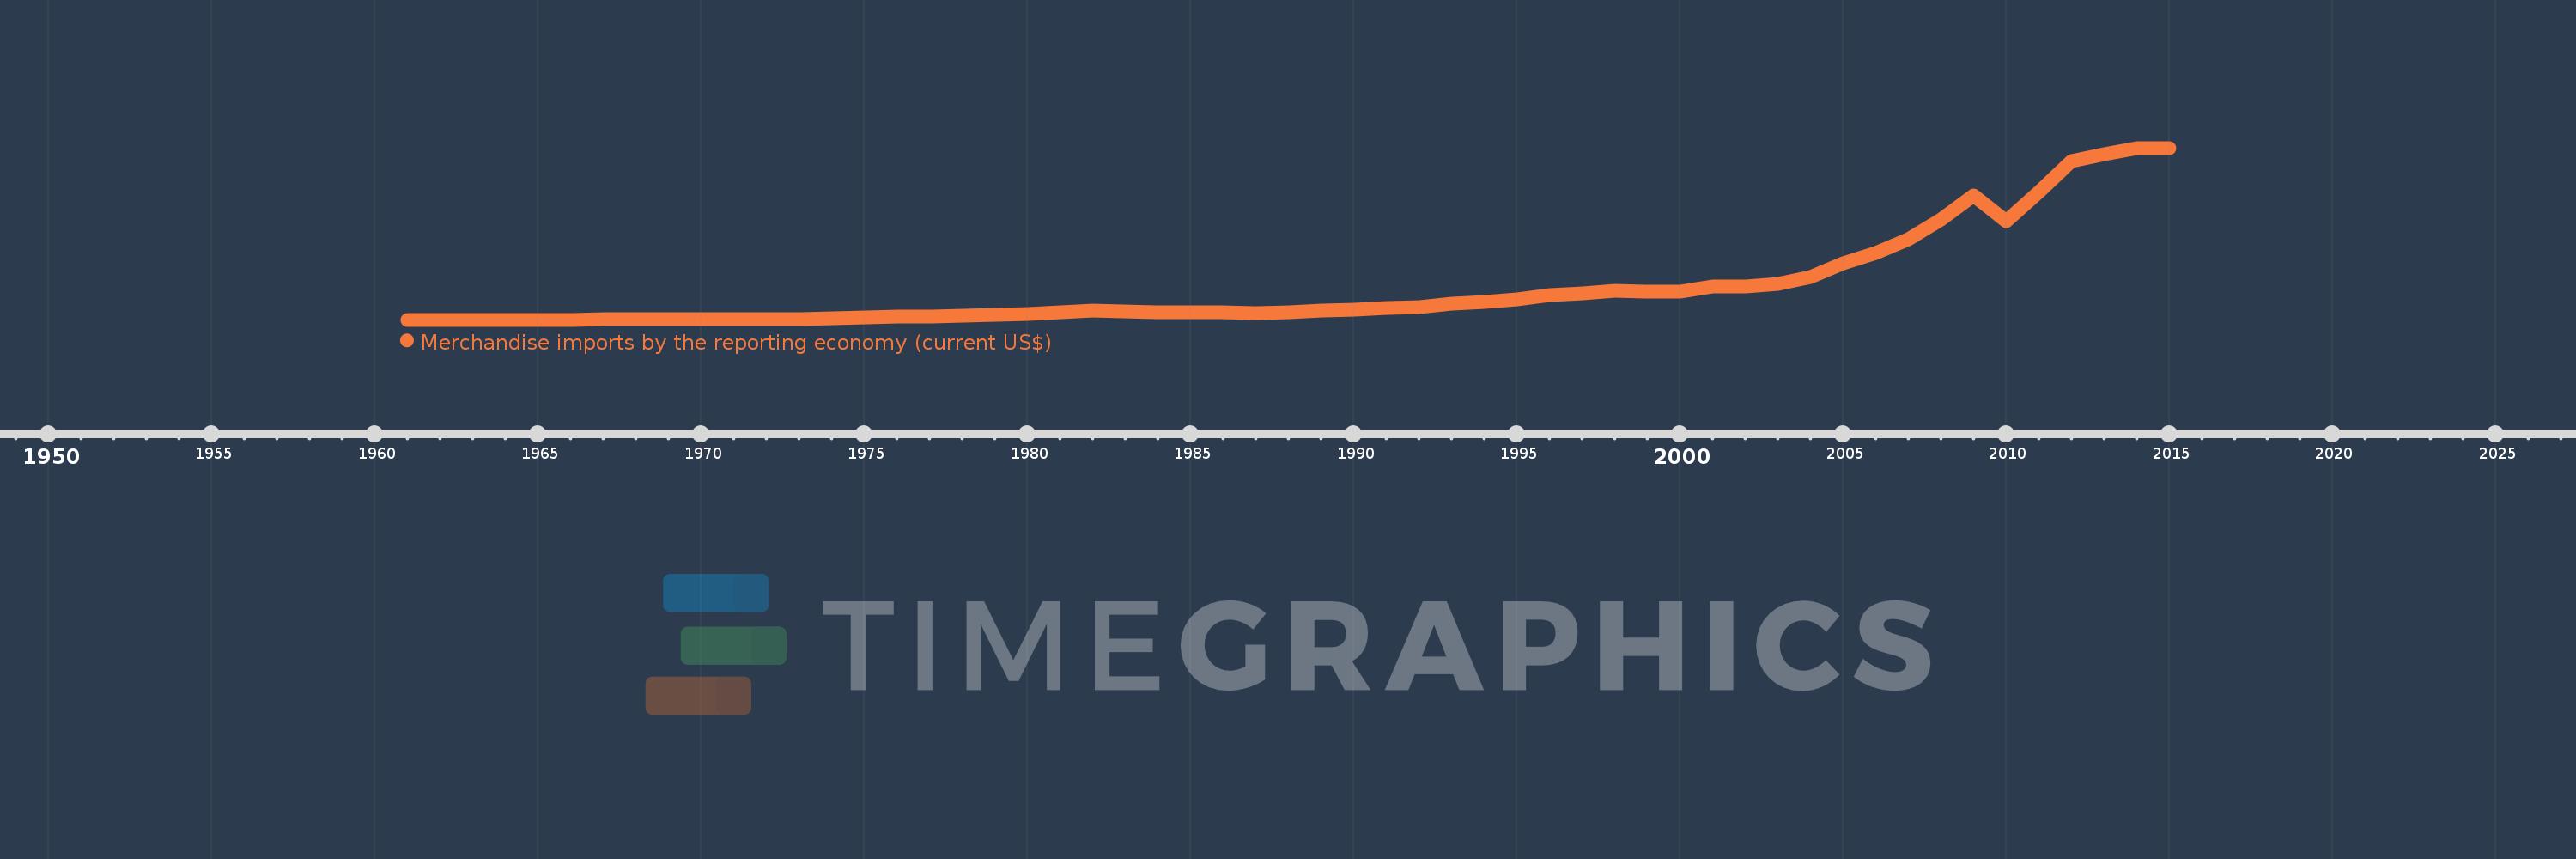
Diese Zeitleiste vorliegt die Graphik ab 1961 J. bis 2015 J. IDA & IBRD total. Die Angaben bis 1960 J. sind nicht vorhanden. Die Zahl aktueller Beobachtungen nach Daten: 55.
Die Quelle (Bezeichnung):
Kennzahlen der Weltentwicklung
Die Quelle (Einrichtung):
World Bank staff estimates based data from International Monetary Fund's Direction of Trade database.
Kategorien:
Private Sector, Trade
Es wurde aktualisiert:
23 Apr 2017 Jahr
Kennzahlen der Wertänderungen vom Jahr zum Jahr
im Durchschnitt:
1.278 Trln
Minimum:
21.881 Mlrd.
1 Jan 1963 Jahr
Maximum:
6.655 Trln
1 Jan 2014 Jahr
Zum Datum der Beobachtung
Wert
Absolute Veränderung
Die Veränderung bezüglich dem vorherigen Wert
1 Jan 1961 Jahr
22.149 Mlrd.
+22.149 Mlrd.
0.0%
1 Jan 1962 Jahr
23.46 Mlrd.
+1.311 Mlrd.
5.92%
1 Jan 1963 Jahr
21.881 Mlrd.
-1.578 Mlrd.
-6.73%
1 Jan 1964 Jahr
23.28 Mlrd.
+1.399 Mlrd.
6.39%
1 Jan 1965 Jahr
27.07 Mlrd.
+3.789 Mlrd.
16.28%
1 Jan 1966 Jahr
27.729 Mlrd.
+658.835 Mln.
2.43%
1 Jan 1967 Jahr
30.096 Mlrd.
+2.368 Mlrd.
8.54%
1 Jan 1968 Jahr
32.367 Mlrd.
+2.271 Mlrd.
7.54%
1 Jan 1969 Jahr
34.741 Mlrd.
+2.374 Mlrd.
7.33%
1 Jan 1970 Jahr
36.642 Mlrd.
+1.901 Mlrd.
5.47%
1 Jan 1971 Jahr
43.757 Mlrd.
+7.115 Mlrd.
19.42%
1 Jan 1972 Jahr
47.931 Mlrd.
+4.174 Mlrd.
9.54%
1 Jan 1973 Jahr
55.16 Mlrd.
+7.229 Mlrd.
15.08%
1 Jan 1974 Jahr
78.831 Mlrd.
+23.671 Mlrd.
42.91%
1 Jan 1975 Jahr
125.267 Mlrd.
+46.436 Mlrd.
58.91%
1 Jan 1976 Jahr
150.662 Mlrd.
+25.395 Mlrd.
20.27%
1 Jan 1977 Jahr
156.982 Mlrd.
+6.32 Mlrd.
4.19%
1 Jan 1978 Jahr
183.695 Mlrd.
+26.714 Mlrd.
17.02%
1 Jan 1979 Jahr
213.833 Mlrd.
+30.138 Mlrd.
16.41%
1 Jan 1980 Jahr
242.519 Mlrd.
+28.686 Mlrd.
13.42%
1 Jan 1981 Jahr
301.181 Mlrd.
+58.662 Mlrd.
24.19%
1 Jan 1982 Jahr
371.727 Mlrd.
+70.546 Mlrd.
23.42%
1 Jan 1983 Jahr
329.511 Mlrd.
-42.216 Mlrd.
-11.36%
1 Jan 1984 Jahr
297.719 Mlrd.
-31.792 Mlrd.
-9.65%
1 Jan 1985 Jahr
294.885 Mlrd.
-2.834 Mlrd.
-0.95%
1 Jan 1986 Jahr
301.297 Mlrd.
+6.412 Mlrd.
2.17%
1 Jan 1987 Jahr
292.653 Mlrd.
-8.644 Mlrd.
-2.87%
1 Jan 1988 Jahr
318.739 Mlrd.
+26.086 Mlrd.
8.91%
1 Jan 1989 Jahr
366.375 Mlrd.
+47.636 Mlrd.
14.95%
1 Jan 1990 Jahr
400.154 Mlrd.
+33.779 Mlrd.
9.22%
1 Jan 1991 Jahr
461.208 Mlrd.
+61.054 Mlrd.
15.26%
1 Jan 1992 Jahr
518.616 Mlrd.
+57.408 Mlrd.
12.45%
1 Jan 1993 Jahr
642.196 Mlrd.
+123.579 Mlrd.
23.83%
1 Jan 1994 Jahr
695.939 Mlrd.
+53.743 Mlrd.
8.37%
1 Jan 1995 Jahr
793.438 Mlrd.
+97.499 Mlrd.
14.01%
1 Jan 1996 Jahr
969.332 Mlrd.
+175.894 Mlrd.
22.17%
1 Jan 1997 Jahr
1.046 Trln
+76.625 Mlrd.
7.9%
1 Jan 1998 Jahr
1.125 Trln
+78.942 Mlrd.
7.55%
1 Jan 1999 Jahr
1.102 Trln
-23.017 Mlrd.
-2.05%
1 Jan 2000 Jahr
1.105 Trln
+3.388 Mlrd.
0.31%
1 Jan 2001 Jahr
1.312 Trln
+206.481 Mlrd.
18.68%
1 Jan 2002 Jahr
1.309 Trln
-3.011 Mlrd.
-0.23%
1 Jan 2003 Jahr
1.404 Trln
+94.943 Mlrd.
7.25%
1 Jan 2004 Jahr
1.68 Trln
+276.291 Mlrd.
19.68%
1 Jan 2005 Jahr
2.189 Trln
+509.074 Mlrd.
30.3%
1 Jan 2006 Jahr
2.613 Trln
+423.528 Mlrd.
19.35%
1 Jan 2007 Jahr
3.14 Trln
+527.254 Mlrd.
20.18%
1 Jan 2008 Jahr
3.879 Trln
+739.05 Mlrd.
23.54%
1 Jan 2009 Jahr
4.815 Trln
+936.617 Mlrd.
24.15%
1 Jan 2010 Jahr
3.829 Trln
-986.894 Mlrd.
-20.49%
1 Jan 2011 Jahr
4.944 Trln
+1.116 Trln
29.14%
1 Jan 2012 Jahr
6.144 Trln
+1.2 Trln
24.27%
1 Jan 2013 Jahr
6.399 Trln
+254.927 Mlrd.
4.15%
1 Jan 2014 Jahr
6.655 Trln
+256.046 Mlrd.
4.0%
1 Jan 2015 Jahr
6.646 Trln
-9.866 Mlrd.
-0.15%
Bewertung der Länder gemäß mit laufender Statistik nach Jahren


Kommentare: