29
/de/
de
AIzaSyAYiBZKx7MnpbEhh9jyipgxe19OcubqV5w
April 1, 2024
130742
Ethiopia
ETH
true
2
1
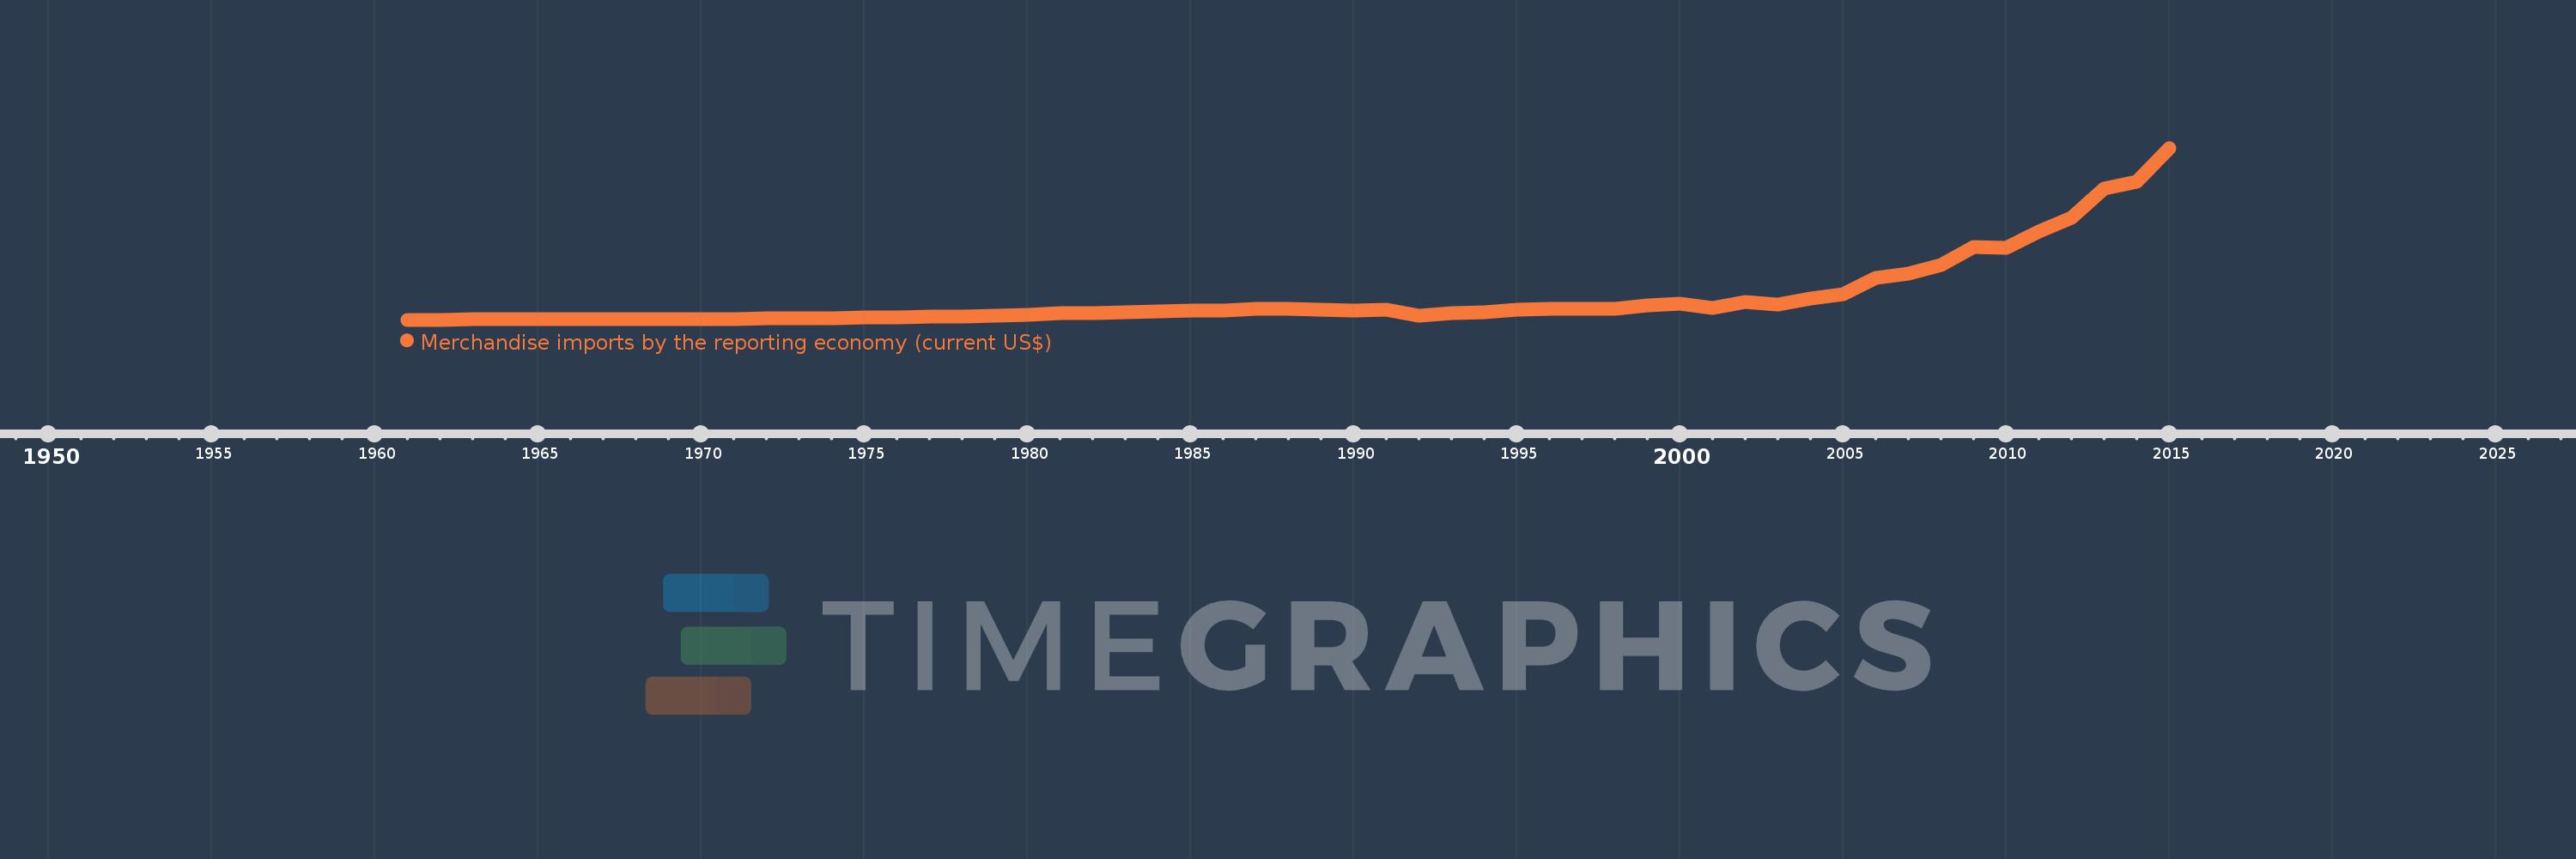
Merchandise imports by the reporting economy (current US$)
2015,2014,2013,2012,2011,2010,2009,2008,2007,2006,2005,2004,2003,2002,2001,2000,1999,1998,1997,1996,1995,1994,1993,1992,1991,1990,1989,1988,1987,1986,1985,1984,1983,1982,1981,1980,1979,1978,1977,1976,1975,1974,1973,1972,1971,1970,1969,1968,1967,1966,1965,1964,1963,1962,1961
Diese Statistik in anderen Ländern:
AfghanistanAlbaniaAlgeriaAmerican SamoaAngolaAntigua and BarbudaArab WorldArgentinaArmeniaArubaAustraliaAustriaAzerbaijanBahamas, TheBahrainBangladeshBarbadosBelarusBelgiumBelizeBeninBermudaBoliviaBosnia and HerzegovinaBrazilBrunei DarussalamBulgariaBurkina FasoBurundiCabo VerdeCambodiaCameroonCanadaCaribbean small statesCentral African RepublicCentral Europe and the BalticsChadChileChinaColombiaComorosCongo, Dem. Rep.Congo, Rep.Costa RicaCote d'IvoireCroatiaCubaCyprusCzech RepublicDenmarkDjiboutiDominicaDominican RepublicEarly-demographic dividendEast Asia & PacificEast Asia & Pacific (excluding high income)East Asia & Pacific (IDA & IBRD countries)EcuadorEgypt, Arab Rep.El SalvadorEquatorial GuineaEstoniaEthiopiaEuro areaEurope & Central AsiaEurope & Central Asia (excluding high income)Europe & Central Asia (IDA & IBRD countries)European UnionFaroe IslandsFijiFinlandFragile and conflict affected situationsFranceFrench PolynesiaGabonGambia, TheGeorgiaGermanyGhanaGibraltarGreeceGreenlandGrenadaGuamGuatemalaGuineaGuinea-BissauGuyanaHaitiHeavily indebted poor countries (HIPC)High incomeHondurasHong Kong SAR, ChinaHungaryIBRD onlyIcelandIDA & IBRD totalIDA blendIDA onlyIDA totalIndiaIndonesiaIran, Islamic Rep.IraqIrelandIsraelItalyJamaicaJapanJordanKazakhstanKenyaKiribatiKorea, Dem. People’s Rep.Korea, Rep.KosovoKuwaitKyrgyz RepublicLao PDRLate-demographic dividendLatin America & Caribbean Latin America & Caribbean (excluding high income)Latin America & the Caribbean (IDA & IBRD countries)LatviaLeast developed countries: UN classificationLebanonLiberiaLibyaLithuaniaLow & middle incomeLow incomeLower middle incomeLuxembourgMacao SAR, ChinaMacedonia, FYRMadagascarMalawiMalaysiaMaldivesMaliMaltaMauritaniaMauritiusMexicoMiddle East & North AfricaMiddle East & North Africa (excluding high income)Middle East & North Africa (IDA & IBRD countries)Middle incomeMoldovaMongoliaMontenegroMoroccoMozambiqueMyanmarNauruNepalNetherlandsNew CaledoniaNew ZealandNicaraguaNigerNigeriaNorth AmericaNorwayOECD membersOmanOther small statesPacific island small statesPakistanPanamaPapua New GuineaParaguayPeruPhilippinesPolandPortugalPost-demographic dividendPre-demographic dividendQatarRomaniaRussian FederationRwandaSamoaSao Tome and PrincipeSaudi ArabiaSenegalSerbiaSeychellesSierra LeoneSingaporeSlovak RepublicSloveniaSmall statesSolomon IslandsSomaliaSouth AfricaSouth AsiaSouth Asia (IDA & IBRD)SpainSri LankaSt. Kitts and NevisSt. LuciaSt. Vincent and the GrenadinesSub-Saharan Africa Sub-Saharan Africa (excluding high income)Sub-Saharan Africa (IDA & IBRD countries)SudanSurinameSwedenSwitzerlandSyrian Arab RepublicTajikistanTanzaniaThailandTogoTongaTrinidad and TobagoTunisiaTurkeyTurkmenistanTuvaluUgandaUkraineUnited Arab EmiratesUnited KingdomUnited StatesUpper middle incomeUruguayUzbekistanVanuatuVenezuela, RBVietnamWorldYemen, Rep.ZambiaZimbabwe Zeitlinie:
Diese Zeitleiste vorliegt die Graphik ab 1961 J. bis 2015 J. Ethiopia. Die Angaben bis 1960 J. sind nicht vorhanden. Die Zahl aktueller Beobachtungen nach Daten: 55.
Die Quelle (Bezeichnung):
Kennzahlen der Weltentwicklung
Die Quelle (Einrichtung):
World Bank staff estimates based data from International Monetary Fund's Direction of Trade database.
Kategorien:
Private Sector, Trade
Es wurde aktualisiert:
23 Apr 2017 Jahr
Kennzahlen der Wertänderungen vom Jahr zum Jahr
im Durchschnitt:
2.236 Mlrd.
Minimum:
83.3 Mln.
1 Jan 1961 Jahr
Maximum:
16.65 Mlrd.
1 Jan 2015 Jahr
Zum Datum der Beobachtung
Wert
Absolute Veränderung
Die Veränderung bezüglich dem vorherigen Wert
1 Jan 1961 Jahr
83.3 Mln.
+83.3 Mln.
0.0%
1 Jan 1962 Jahr
93.0 Mln.
+9.7 Mln.
11.64%
1 Jan 1963 Jahr
103.1 Mln.
+10.1 Mln.
10.86%
1 Jan 1964 Jahr
110.8 Mln.
+7.7 Mln.
7.47%
1 Jan 1965 Jahr
122.4 Mln.
+11.6 Mln.
10.47%
1 Jan 1966 Jahr
149.0 Mln.
+26.6 Mln.
21.73%
1 Jan 1967 Jahr
161.1 Mln.
+12.1 Mln.
8.12%
1 Jan 1968 Jahr
142.8 Mln.
-18.3 Mln.
-11.36%
1 Jan 1969 Jahr
171.8 Mln.
+29.0 Mln.
20.31%
1 Jan 1970 Jahr
155.323 Mln.
-16.477 Mln.
-9.59%
1 Jan 1971 Jahr
171.639 Mln.
+16.316 Mln.
10.5%
1 Jan 1972 Jahr
187.809 Mln.
+16.17 Mln.
9.42%
1 Jan 1973 Jahr
189.309 Mln.
+1.5 Mln.
0.8%
1 Jan 1974 Jahr
218.39 Mln.
+29.081 Mln.
15.36%
1 Jan 1975 Jahr
284.108 Mln.
+65.718 Mln.
30.09%
1 Jan 1976 Jahr
310.793 Mln.
+26.685 Mln.
9.39%
1 Jan 1977 Jahr
355.238 Mln.
+44.445 Mln.
14.3%
1 Jan 1978 Jahr
351.611 Mln.
-3.627 Mln.
-1.02%
1 Jan 1979 Jahr
455.425 Mln.
+103.814 Mln.
29.53%
1 Jan 1980 Jahr
571.835 Mln.
+116.41 Mln.
25.56%
1 Jan 1981 Jahr
722.078 Mln.
+150.243 Mln.
26.27%
1 Jan 1982 Jahr
737.708 Mln.
+15.63 Mln.
2.16%
1 Jan 1983 Jahr
786.217 Mln.
+48.509 Mln.
6.58%
1 Jan 1984 Jahr
878.976 Mln.
+92.759 Mln.
11.8%
1 Jan 1985 Jahr
928.758 Mln.
+49.782 Mln.
5.66%
1 Jan 1986 Jahr
988.532 Mln.
+59.774 Mln.
6.44%
1 Jan 1987 Jahr
1.102 Mlrd.
+113.111 Mln.
11.44%
1 Jan 1988 Jahr
1.11 Mlrd.
+8.074 Mln.
0.73%
1 Jan 1989 Jahr
1.088 Mlrd.
-21.847 Mln.
-1.97%
1 Jan 1990 Jahr
960.186 Mln.
-127.684 Mln.
-11.74%
1 Jan 1991 Jahr
1.078 Mlrd.
+117.385 Mln.
12.23%
1 Jan 1992 Jahr
504.964 Mln.
-572.607 Mln.
-53.14%
1 Jan 1993 Jahr
709.295 Mln.
+204.331 Mln.
40.46%
1 Jan 1994 Jahr
770.4 Mln.
+61.105 Mln.
8.61%
1 Jan 1995 Jahr
1.034 Mlrd.
+263.985 Mln.
34.27%
1 Jan 1996 Jahr
1.153 Mlrd.
+118.606 Mln.
11.47%
1 Jan 1997 Jahr
1.122 Mlrd.
-31.095 Mln.
-2.7%
1 Jan 1998 Jahr
1.162 Mlrd.
+40.496 Mln.
3.61%
1 Jan 1999 Jahr
1.46 Mlrd.
+297.291 Mln.
25.58%
1 Jan 2000 Jahr
1.674 Mlrd.
+213.932 Mln.
14.66%
1 Jan 2001 Jahr
1.226 Mlrd.
-447.39 Mln.
-26.73%
1 Jan 2002 Jahr
1.783 Mlrd.
+556.35 Mln.
45.37%
1 Jan 2003 Jahr
1.568 Mlrd.
-214.962 Mln.
-12.06%
1 Jan 2004 Jahr
2.102 Mlrd.
+534.467 Mln.
34.09%
1 Jan 2005 Jahr
2.557 Mlrd.
+455.24 Mln.
21.66%
1 Jan 2006 Jahr
4.082 Mlrd.
+1.524 Mlrd.
59.6%
1 Jan 2007 Jahr
4.532 Mlrd.
+450.885 Mln.
11.05%
1 Jan 2008 Jahr
5.335 Mlrd.
+802.662 Mln.
17.71%
1 Jan 2009 Jahr
7.093 Mlrd.
+1.758 Mlrd.
32.95%
1 Jan 2010 Jahr
7.041 Mlrd.
-51.552 Mln.
-0.73%
1 Jan 2011 Jahr
8.631 Mlrd.
+1.59 Mlrd.
22.58%
1 Jan 2012 Jahr
9.943 Mlrd.
+1.312 Mlrd.
15.2%
1 Jan 2013 Jahr
12.749 Mlrd.
+2.806 Mlrd.
28.22%
1 Jan 2014 Jahr
13.354 Mlrd.
+605.348 Mln.
4.75%
1 Jan 2015 Jahr
16.65 Mlrd.
+3.296 Mlrd.
24.68%
Bewertung der Länder gemäß mit laufender Statistik nach Jahren


Kommentare: