29
/de/
de
AIzaSyAYiBZKx7MnpbEhh9jyipgxe19OcubqV5w
April 1, 2024
35226
Heavily indebted poor countries (HIPC)
HPC
false
2
1
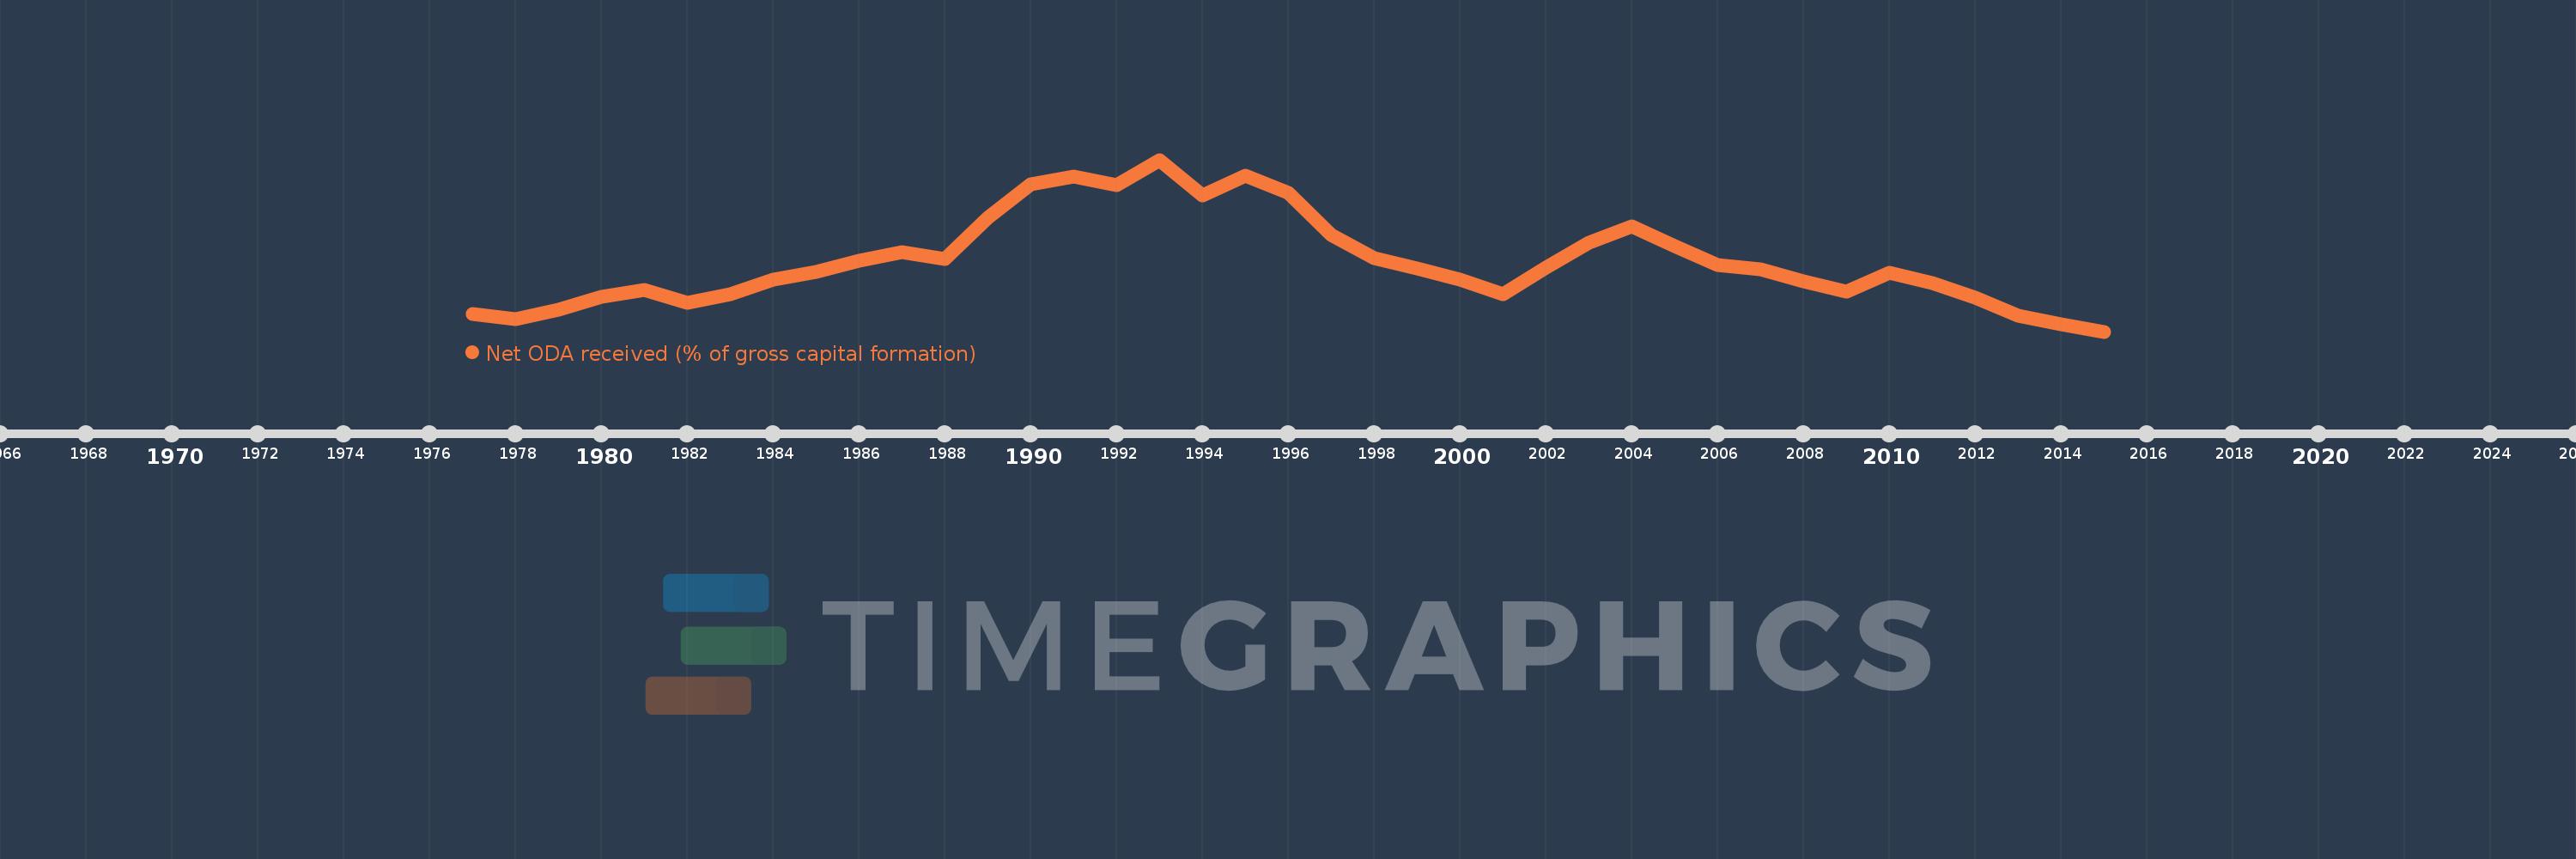
Net ODA received (% of gross capital formation)
2015,2014,2013,2012,2011,2010,2009,2008,2007,2006,2005,2004,2003,2002,2001,2000,1999,1998,1997,1996,1995,1994,1993,1992,1991,1990,1989,1988,1987,1986,1985,1984,1983,1982,1981,1980,1979,1978,1977
Diese Statistik in anderen Ländern:
AfghanistanAlbaniaAlgeriaAngolaAntigua and BarbudaArab WorldArgentinaArmeniaArubaAzerbaijanBahamas, TheBahrainBangladeshBarbadosBelarusBelizeBeninBhutanBoliviaBosnia and HerzegovinaBotswanaBrazilBrunei DarussalamBurkina FasoBurundiCabo VerdeCambodiaCameroonCaribbean small statesCentral African RepublicCentral Europe and the BalticsChadChileChinaColombiaComorosCongo, Dem. Rep.Congo, Rep.Costa RicaCote d'IvoireCroatiaCubaCyprusDjiboutiDominicaDominican RepublicEast Asia & PacificEast Asia & Pacific (excluding high income)East Asia & Pacific (IDA & IBRD countries)EcuadorEgypt, Arab Rep.El SalvadorEquatorial GuineaEritreaEthiopiaEuro areaEurope & Central AsiaEurope & Central Asia (excluding high income)Europe & Central Asia (IDA & IBRD countries)European UnionFijiFragile and conflict affected situationsGabonGambia, TheGeorgiaGhanaGrenadaGuatemalaGuineaGuinea-BissauGuyanaHaitiHeavily indebted poor countries (HIPC)High incomeHondurasHong Kong SAR, ChinaIBRD onlyIDA & IBRD totalIDA blendIDA onlyIDA totalIndiaIndonesiaIran, Islamic Rep.IraqIsraelJamaicaJordanKazakhstanKenyaKiribatiKorea, Rep.KosovoKuwaitKyrgyz RepublicLao PDRLatin America & Caribbean Latin America & Caribbean (excluding high income)Latin America & the Caribbean (IDA & IBRD countries)Least developed countries: UN classificationLebanonLesothoLiberiaLibyaLow & middle incomeLow incomeLower middle incomeMacao SAR, ChinaMacedonia, FYRMadagascarMalawiMalaysiaMaldivesMaliMaltaMauritaniaMauritiusMexicoMiddle East & North AfricaMiddle East & North Africa (excluding high income)Middle East & North Africa (IDA & IBRD countries)Middle incomeMoldovaMongoliaMontenegroMoroccoMozambiqueNamibiaNepalNew CaledoniaNicaraguaNigerNigeriaNorth AmericaOECD membersOmanOther small statesPakistanPanamaPapua New GuineaParaguayPeruPhilippinesQatarRwandaSaudi ArabiaSenegalSerbiaSeychellesSierra LeoneSingaporeSloveniaSmall statesSolomon IslandsSouth AfricaSouth AsiaSouth Asia (IDA & IBRD)South SudanSri LankaSt. Kitts and NevisSt. LuciaSt. Vincent and the GrenadinesSub-Saharan Africa Sub-Saharan Africa (excluding high income)Sub-Saharan Africa (IDA & IBRD countries)SudanSurinameSwazilandSyrian Arab RepublicTajikistanTanzaniaThailandTimor-LesteTogoTongaTrinidad and TobagoTunisiaTurkeyTurkmenistanUgandaUkraineUpper middle incomeUruguayUzbekistanVanuatuVenezuela, RBVietnamWest Bank and GazaWorldYemen, Rep.ZambiaZimbabwe Zeitlinie:
Diese Zeitleiste vorliegt die Graphik ab 1977 J. bis 2015 J. Heavily indebted poor countries (HIPC). Die Angaben bis 1976 J. sind nicht vorhanden. Die Zahl aktueller Beobachtungen nach Daten: 39.
Die Quelle (Bezeichnung):
Kennzahlen der Weltentwicklung
Die Quelle (Einrichtung):
Development Assistance Committee of the Organisation for Economic Co-operation and Development, Geographical Distribution of Financial Flows to Developing Countries, Development Co-operation Report, and International Development Statistics database. Data are available online at: www.oecd.org/dac/stats/idsonline. World Bank gross capital formation estimates are used for the denominator.
Kategorien:
Aid Effectiveness
Es wurde aktualisiert:
23 Apr 2017 Jahr
Kennzahlen der Wertänderungen vom Jahr zum Jahr
Minimum:
22.912
1 Jan 2015 Jahr
Maximum:
90.442
1 Jan 1993 Jahr
Zum Datum der Beobachtung
Wert
Absolute Veränderung
Die Veränderung bezüglich dem vorherigen Wert
1 Jan 1977 Jahr
29.832
+29.832
0.0%
1 Jan 1978 Jahr
27.804
-2.028
-6.8%
1 Jan 1979 Jahr
31.564
+3.76
13.52%
1 Jan 1980 Jahr
36.707
+5.143
16.29%
1 Jan 1981 Jahr
39.426
+2.719
7.41%
1 Jan 1982 Jahr
34.164
-5.262
-13.35%
1 Jan 1983 Jahr
37.549
+3.385
9.91%
1 Jan 1984 Jahr
43.37
+5.821
15.5%
1 Jan 1985 Jahr
46.364
+2.995
6.9%
1 Jan 1986 Jahr
50.762
+4.397
9.48%
1 Jan 1987 Jahr
54.145
+3.383
6.66%
1 Jan 1988 Jahr
51.391
-2.753
-5.09%
1 Jan 1989 Jahr
67.673
+16.281
31.68%
1 Jan 1990 Jahr
80.76
+13.088
19.34%
1 Jan 1991 Jahr
83.736
+2.976
3.68%
1 Jan 1992 Jahr
80.399
-3.337
-3.99%
1 Jan 1993 Jahr
90.442
+10.043
12.49%
1 Jan 1994 Jahr
76.295
-14.147
-15.64%
1 Jan 1995 Jahr
84.339
+8.044
10.54%
1 Jan 1996 Jahr
77.402
-6.937
-8.23%
1 Jan 1997 Jahr
60.964
-16.438
-21.24%
1 Jan 1998 Jahr
51.934
-9.03
-14.81%
1 Jan 1999 Jahr
47.757
-4.177
-8.04%
1 Jan 2000 Jahr
43.196
-4.561
-9.55%
1 Jan 2001 Jahr
37.744
-5.452
-12.62%
1 Jan 2002 Jahr
48.156
+10.411
27.58%
1 Jan 2003 Jahr
57.997
+9.841
20.44%
1 Jan 2004 Jahr
64.184
+6.188
10.67%
1 Jan 2005 Jahr
56.556
-7.629
-11.89%
1 Jan 2006 Jahr
49.167
-7.389
-13.06%
1 Jan 2007 Jahr
47.28
-1.888
-3.84%
1 Jan 2008 Jahr
42.497
-4.782
-10.11%
1 Jan 2009 Jahr
38.476
-4.022
-9.46%
1 Jan 2010 Jahr
46.123
+7.648
19.88%
1 Jan 2011 Jahr
42.095
-4.029
-8.73%
1 Jan 2012 Jahr
36.315
-5.78
-13.73%
1 Jan 2013 Jahr
29.126
-7.189
-19.8%
1 Jan 2014 Jahr
25.931
-3.195
-10.97%
1 Jan 2015 Jahr
22.912
-3.019
-11.64%
Bewertung der Länder gemäß mit laufender Statistik nach Jahren


Kommentare: