29
/de/
de
AIzaSyAYiBZKx7MnpbEhh9jyipgxe19OcubqV5w
April 1, 2024
219933
Papua New Guinea
PNG
true
2
1
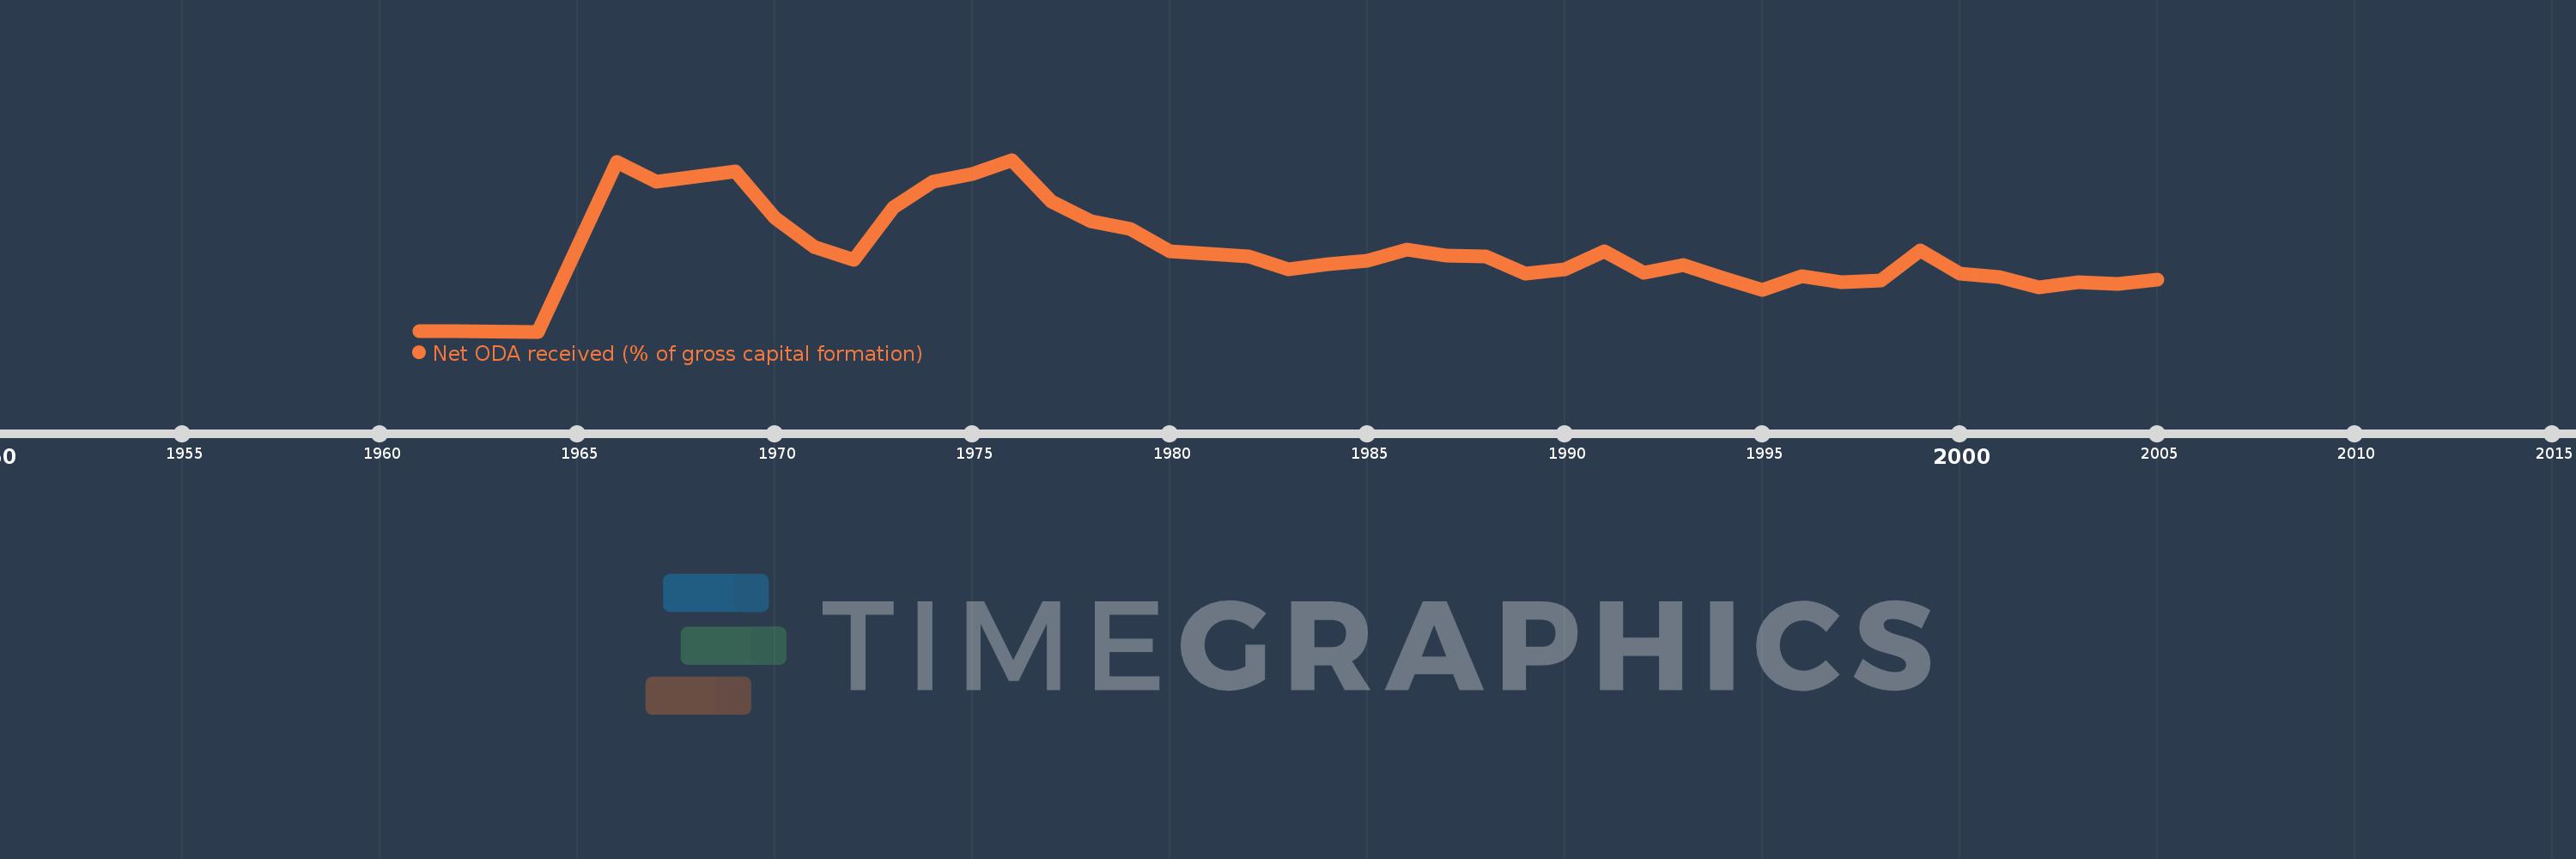
Net ODA received (% of gross capital formation)
2005,2004,2003,2002,2001,2000,1999,1998,1997,1996,1995,1994,1993,1992,1991,1990,1989,1988,1987,1986,1985,1984,1983,1982,1981,1980,1979,1978,1977,1976,1975,1974,1973,1972,1971,1970,1969,1968,1967,1966,1964,1962,1961
Diese Statistik in anderen Ländern:
AfghanistanAlbaniaAlgeriaAngolaAntigua and BarbudaArab WorldArgentinaArmeniaArubaAzerbaijanBahamas, TheBahrainBangladeshBarbadosBelarusBelizeBeninBhutanBoliviaBosnia and HerzegovinaBotswanaBrazilBrunei DarussalamBurkina FasoBurundiCabo VerdeCambodiaCameroonCaribbean small statesCentral African RepublicCentral Europe and the BalticsChadChileChinaColombiaComorosCongo, Dem. Rep.Congo, Rep.Costa RicaCote d'IvoireCroatiaCubaCyprusDjiboutiDominicaDominican RepublicEast Asia & PacificEast Asia & Pacific (excluding high income)East Asia & Pacific (IDA & IBRD countries)EcuadorEgypt, Arab Rep.El SalvadorEquatorial GuineaEritreaEthiopiaEuro areaEurope & Central AsiaEurope & Central Asia (excluding high income)Europe & Central Asia (IDA & IBRD countries)European UnionFijiFragile and conflict affected situationsGabonGambia, TheGeorgiaGhanaGrenadaGuatemalaGuineaGuinea-BissauGuyanaHaitiHeavily indebted poor countries (HIPC)High incomeHondurasHong Kong SAR, ChinaIBRD onlyIDA & IBRD totalIDA blendIDA onlyIDA totalIndiaIndonesiaIran, Islamic Rep.IraqIsraelJamaicaJordanKazakhstanKenyaKiribatiKorea, Rep.KosovoKuwaitKyrgyz RepublicLao PDRLatin America & Caribbean Latin America & Caribbean (excluding high income)Latin America & the Caribbean (IDA & IBRD countries)Least developed countries: UN classificationLebanonLesothoLiberiaLibyaLow & middle incomeLow incomeLower middle incomeMacao SAR, ChinaMacedonia, FYRMadagascarMalawiMalaysiaMaldivesMaliMaltaMauritaniaMauritiusMexicoMiddle East & North AfricaMiddle East & North Africa (excluding high income)Middle East & North Africa (IDA & IBRD countries)Middle incomeMoldovaMongoliaMontenegroMoroccoMozambiqueNamibiaNepalNew CaledoniaNicaraguaNigerNigeriaNorth AmericaOECD membersOmanOther small statesPakistanPanamaPapua New GuineaParaguayPeruPhilippinesQatarRwandaSaudi ArabiaSenegalSerbiaSeychellesSierra LeoneSingaporeSloveniaSmall statesSolomon IslandsSouth AfricaSouth AsiaSouth Asia (IDA & IBRD)South SudanSri LankaSt. Kitts and NevisSt. LuciaSt. Vincent and the GrenadinesSub-Saharan Africa Sub-Saharan Africa (excluding high income)Sub-Saharan Africa (IDA & IBRD countries)SudanSurinameSwazilandSyrian Arab RepublicTajikistanTanzaniaThailandTimor-LesteTogoTongaTrinidad and TobagoTunisiaTurkeyTurkmenistanUgandaUkraineUpper middle incomeUruguayUzbekistanVanuatuVenezuela, RBVietnamWest Bank and GazaWorldYemen, Rep.ZambiaZimbabwe Zeitlinie:
Diese Zeitleiste vorliegt die Graphik ab 1961 J. bis 2005 J. Papua New Guinea. Die Angaben bis 1960 J. sind nicht vorhanden. Die Zahl aktueller Beobachtungen nach Daten: 43.
Die Quelle (Bezeichnung):
Kennzahlen der Weltentwicklung
Die Quelle (Einrichtung):
Development Assistance Committee of the Organisation for Economic Co-operation and Development, Geographical Distribution of Financial Flows to Developing Countries, Development Co-operation Report, and International Development Statistics database. Data are available online at: www.oecd.org/dac/stats/idsonline. World Bank gross capital formation estimates are used for the denominator.
Kategorien:
Aid Effectiveness
Es wurde aktualisiert:
23 Apr 2017 Jahr
Kennzahlen der Wertänderungen vom Jahr zum Jahr
Minimum:
0.023
1 Jan 1964 Jahr
Maximum:
112.18
1 Jan 1976 Jahr
Zum Datum der Beobachtung
Wert
Absolute Veränderung
Die Veränderung bezüglich dem vorherigen Wert
1 Jan 1961 Jahr
0.032
+0.032
0.0%
1 Jan 1962 Jahr
0.031
-0.001
-3.83%
1 Jan 1964 Jahr
0.023
-0.009
-27.53%
1 Jan 1966 Jahr
111.021
+110.998
492.3 Tsnd.%
1 Jan 1967 Jahr
97.728
-13.293
-11.97%
1 Jan 1968 Jahr
101.429
+3.701
3.79%
1 Jan 1969 Jahr
104.586
+3.157
3.11%
1 Jan 1970 Jahr
74.236
-30.35
-29.02%
1 Jan 1971 Jahr
54.981
-19.254
-25.94%
1 Jan 1972 Jahr
47.109
-7.873
-14.32%
1 Jan 1973 Jahr
81.141
+34.032
72.24%
1 Jan 1974 Jahr
97.624
+16.484
20.31%
1 Jan 1975 Jahr
102.948
+5.324
5.45%
1 Jan 1976 Jahr
112.18
+9.232
8.97%
1 Jan 1977 Jahr
85.19
-26.99
-24.06%
1 Jan 1978 Jahr
71.914
-13.275
-15.58%
1 Jan 1979 Jahr
67.091
-4.823
-6.71%
1 Jan 1980 Jahr
52.725
-14.367
-21.41%
1 Jan 1981 Jahr
50.719
-2.005
-3.8%
1 Jan 1982 Jahr
49.274
-1.445
-2.85%
1 Jan 1983 Jahr
40.743
-8.531
-17.31%
1 Jan 1984 Jahr
44.081
+3.338
8.19%
1 Jan 1985 Jahr
46.423
+2.342
5.31%
1 Jan 1986 Jahr
53.498
+7.075
15.24%
1 Jan 1987 Jahr
49.517
-3.981
-7.44%
1 Jan 1988 Jahr
49.251
-0.266
-0.54%
1 Jan 1989 Jahr
37.61
-11.642
-23.64%
1 Jan 1990 Jahr
40.89
+3.281
8.72%
1 Jan 1991 Jahr
52.403
+11.512
28.15%
1 Jan 1992 Jahr
38.384
-14.019
-26.75%
1 Jan 1993 Jahr
43.635
+5.251
13.68%
1 Jan 1994 Jahr
34.882
-8.753
-20.06%
1 Jan 1995 Jahr
27.467
-7.415
-21.26%
1 Jan 1996 Jahr
36.403
+8.935
32.53%
1 Jan 1997 Jahr
32.516
-3.886
-10.68%
1 Jan 1998 Jahr
33.318
+0.802
2.47%
1 Jan 1999 Jahr
53.276
+19.958
59.9%
1 Jan 2000 Jahr
37.947
-15.329
-28.77%
1 Jan 2001 Jahr
35.692
-2.255
-5.94%
1 Jan 2002 Jahr
28.685
-7.007
-19.63%
1 Jan 2003 Jahr
32.387
+3.701
12.9%
1 Jan 2004 Jahr
31.258
-1.128
-3.48%
1 Jan 2005 Jahr
34.163
+2.904
9.29%
Bewertung der Länder gemäß mit laufender Statistik nach Jahren


Kommentare: