29
/de/
de
AIzaSyAYiBZKx7MnpbEhh9jyipgxe19OcubqV5w
April 1, 2024
34926
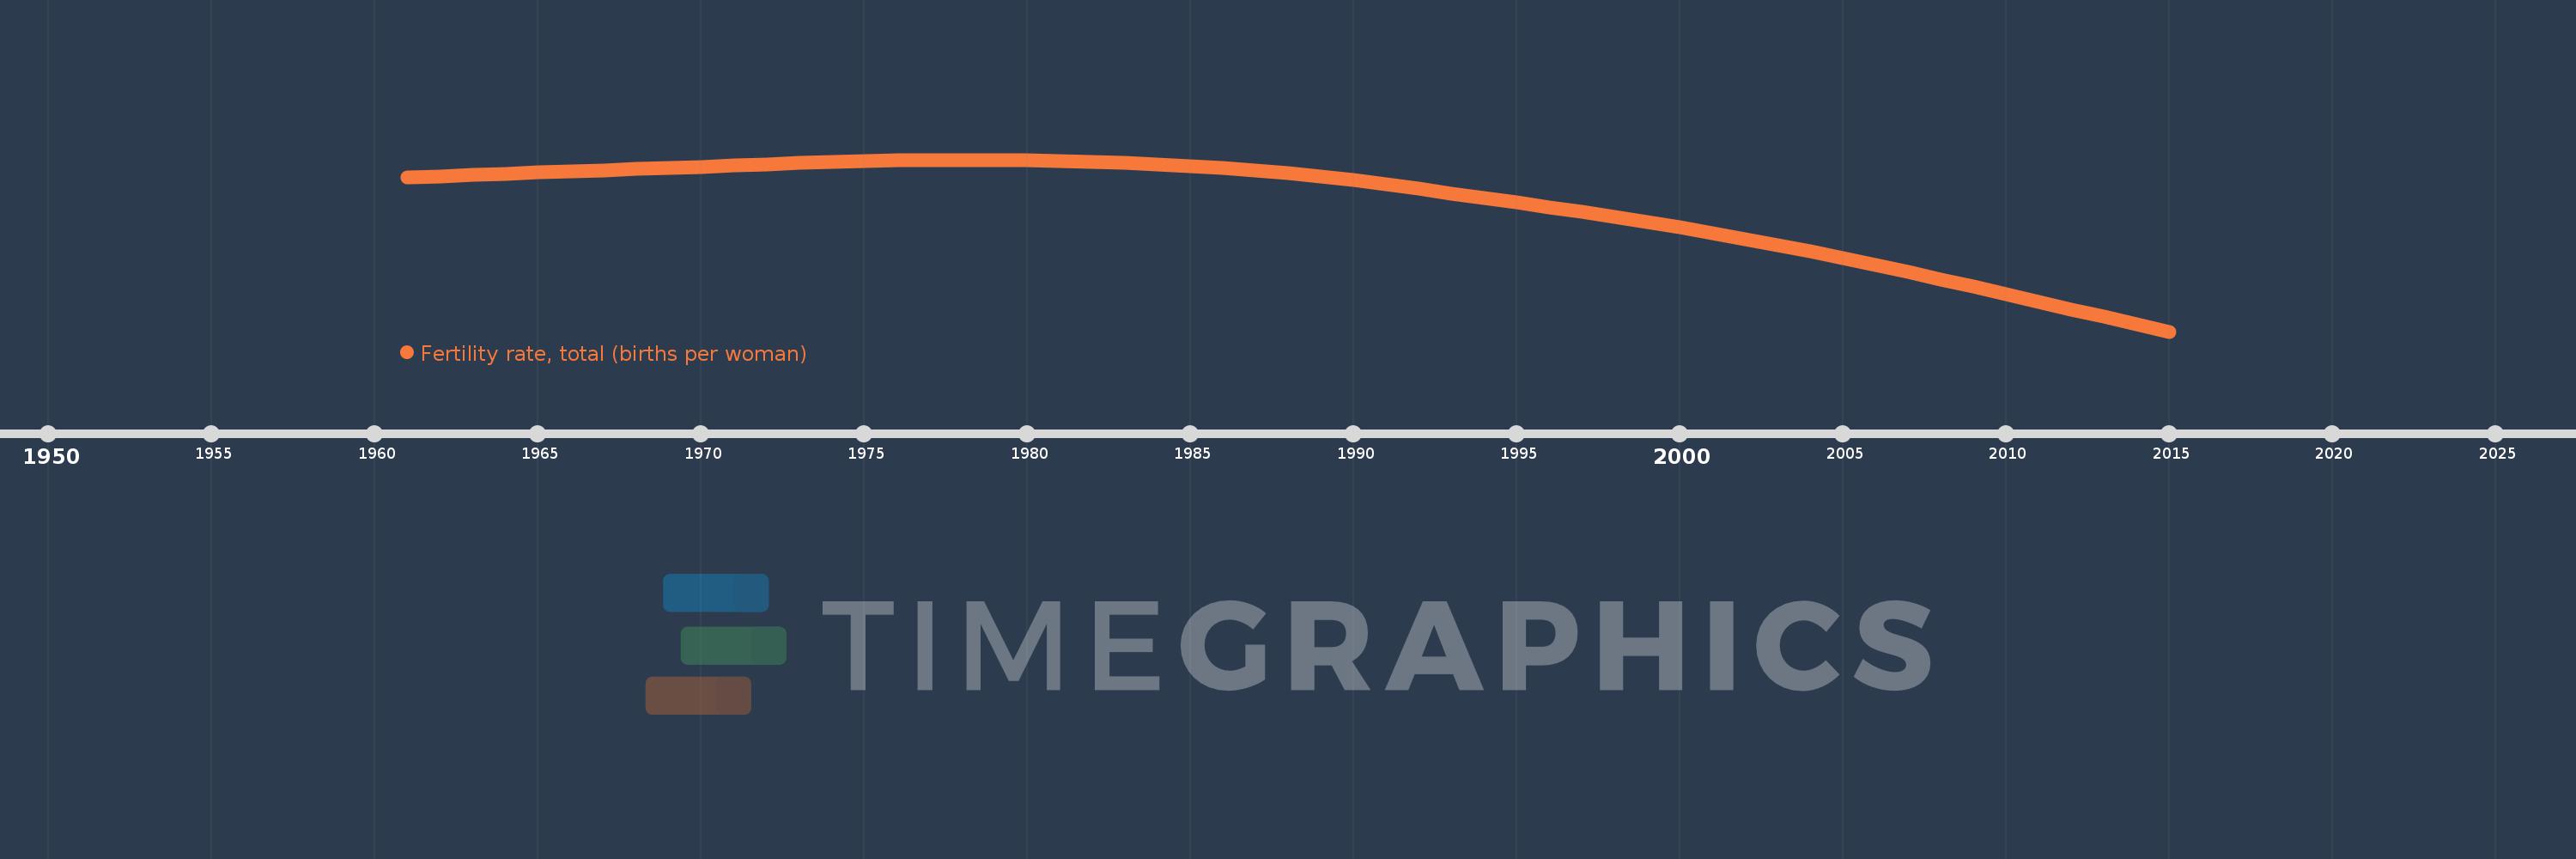
Heavily indebted poor countries (HIPC)
HPC
false
2
1
Fertility rate, total (births per woman)
2015,2014,2013,2012,2011,2010,2009,2008,2007,2006,2005,2004,2003,2002,2001,2000,1999,1998,1997,1996,1995,1994,1993,1992,1991,1990,1989,1988,1987,1986,1985,1984,1983,1982,1981,1980,1979,1978,1977,1976,1975,1974,1973,1972,1971,1970,1969,1968,1967,1966,1965,1964,1963,1962,1961
Diese Statistik in anderen Ländern:
AfghanistanAlbaniaAlgeriaAndorraAngolaAntigua and BarbudaArab WorldArgentinaArmeniaArubaAustraliaAustriaAzerbaijanBahamas, TheBahrainBangladeshBarbadosBelarusBelgiumBelizeBeninBermudaBhutanBoliviaBosnia and HerzegovinaBotswanaBrazilBrunei DarussalamBulgariaBurkina FasoBurundiCabo VerdeCambodiaCameroonCanadaCaribbean small statesCentral African RepublicCentral Europe and the BalticsChadChannel IslandsChileChinaColombiaComorosCongo, Dem. Rep.Congo, Rep.Costa RicaCote d'IvoireCroatiaCubaCuracaoCyprusCzech RepublicDenmarkDjiboutiDominicaDominican RepublicEarly-demographic dividendEast Asia & PacificEast Asia & Pacific (excluding high income)East Asia & Pacific (IDA & IBRD countries)EcuadorEgypt, Arab Rep.El SalvadorEquatorial GuineaEritreaEstoniaEthiopiaEuro areaEurope & Central AsiaEurope & Central Asia (excluding high income)Europe & Central Asia (IDA & IBRD countries)European UnionFaroe IslandsFijiFinlandFragile and conflict affected situationsFranceFrench PolynesiaGabonGambia, TheGeorgiaGermanyGhanaGreeceGreenlandGrenadaGuamGuatemalaGuineaGuinea-BissauGuyanaHaitiHeavily indebted poor countries (HIPC)High incomeHondurasHong Kong SAR, ChinaHungaryIBRD onlyIcelandIDA & IBRD totalIDA blendIDA onlyIDA totalIndiaIndonesiaIran, Islamic Rep.IraqIrelandIsle of ManIsraelItalyJamaicaJapanJordanKazakhstanKenyaKiribatiKorea, Dem. People’s Rep.Korea, Rep.KosovoKuwaitKyrgyz RepublicLao PDRLate-demographic dividendLatin America & Caribbean Latin America & Caribbean (excluding high income)Latin America & the Caribbean (IDA & IBRD countries)LatviaLeast developed countries: UN classificationLebanonLesothoLiberiaLibyaLiechtensteinLithuaniaLow & middle incomeLow incomeLower middle incomeLuxembourgMacao SAR, ChinaMacedonia, FYRMadagascarMalawiMalaysiaMaldivesMaliMaltaMarshall IslandsMauritaniaMauritiusMexicoMicronesia, Fed. Sts.Middle East & North AfricaMiddle East & North Africa (excluding high income)Middle East & North Africa (IDA & IBRD countries)Middle incomeMoldovaMongoliaMontenegroMoroccoMozambiqueMyanmarNamibiaNepalNetherlandsNew CaledoniaNew ZealandNicaraguaNigerNigeriaNorth AmericaNorwayOECD membersOmanOther small statesPacific island small statesPakistanPalauPanamaPapua New GuineaParaguayPeruPhilippinesPolandPortugalPost-demographic dividendPre-demographic dividendPuerto RicoQatarRomaniaRussian FederationRwandaSamoaSan MarinoSao Tome and PrincipeSaudi ArabiaSenegalSerbiaSeychellesSierra LeoneSingaporeSint Maarten (Dutch part)Slovak RepublicSloveniaSmall statesSolomon IslandsSomaliaSouth AfricaSouth AsiaSouth Asia (IDA & IBRD)South SudanSpainSri LankaSt. Kitts and NevisSt. LuciaSt. Martin (French part)St. Vincent and the GrenadinesSub-Saharan Africa Sub-Saharan Africa (excluding high income)Sub-Saharan Africa (IDA & IBRD countries)SudanSurinameSwazilandSwedenSwitzerlandSyrian Arab RepublicTajikistanTanzaniaThailandTimor-LesteTogoTongaTrinidad and TobagoTunisiaTurkeyTurkmenistanUgandaUkraineUnited Arab EmiratesUnited KingdomUnited StatesUpper middle incomeUruguayUzbekistanVanuatuVenezuela, RBVietnamVirgin Islands (U.S.)West Bank and GazaWorldYemen, Rep.ZambiaZimbabwe Zeitlinie:
Diese Zeitleiste vorliegt die Graphik ab 1961 J. bis 2015 J. Heavily indebted poor countries (HIPC). Die Angaben bis 1960 J. sind nicht vorhanden. Die Zahl aktueller Beobachtungen nach Daten: 55.
Die Quelle (Bezeichnung):
Kennzahlen der Weltentwicklung
Die Quelle (Einrichtung):
(1) United Nations Population Division. World Population Prospects, (2) Census reports and other statistical publications from national statistical offices, (3) Eurostat: Demographic Statistics, (4) United Nations Statistical Division. Population and Vital Statistics Reprot (various years), (5) U.S. Census Bureau: International Database, and (6) Secretariat of the Pacific Community: Statistics and Demography Programme.
Kategorien:
Health, Gender
Es wurde aktualisiert:
23 Apr 2017 Jahr
Kennzahlen der Wertänderungen vom Jahr zum Jahr
Minimum:
4.966
1 Jan 2015 Jahr
Maximum:
6.917
1 Jan 1978 Jahr
Zum Datum der Beobachtung
Wert
Absolute Veränderung
Die Veränderung bezüglich dem vorherigen Wert
1 Jan 1961 Jahr
6.716
+6.716
0.0%
1 Jan 1962 Jahr
6.73
+0.014
0.21%
1 Jan 1963 Jahr
6.744
+0.014
0.21%
1 Jan 1964 Jahr
6.758
+0.014
0.21%
1 Jan 1965 Jahr
6.771
+0.013
0.2%
1 Jan 1966 Jahr
6.784
+0.013
0.19%
1 Jan 1967 Jahr
6.797
+0.013
0.19%
1 Jan 1968 Jahr
6.81
+0.013
0.19%
1 Jan 1969 Jahr
6.823
+0.013
0.2%
1 Jan 1970 Jahr
6.837
+0.014
0.2%
1 Jan 1971 Jahr
6.851
+0.014
0.2%
1 Jan 1972 Jahr
6.865
+0.014
0.2%
1 Jan 1973 Jahr
6.878
+0.013
0.2%
1 Jan 1974 Jahr
6.89
+0.012
0.18%
1 Jan 1975 Jahr
6.901
+0.01
0.15%
1 Jan 1976 Jahr
6.909
+0.008
0.12%
1 Jan 1977 Jahr
6.915
+0.006
0.08%
1 Jan 1978 Jahr
6.917
+0.003
0.04%
1 Jan 1979 Jahr
6.917
0.0
0.0%
1 Jan 1980 Jahr
6.914
-0.003
-0.05%
1 Jan 1981 Jahr
6.907
-0.007
-0.1%
1 Jan 1982 Jahr
6.897
-0.01
-0.15%
1 Jan 1983 Jahr
6.883
-0.013
-0.2%
1 Jan 1984 Jahr
6.867
-0.016
-0.24%
1 Jan 1985 Jahr
6.847
-0.02
-0.28%
1 Jan 1986 Jahr
6.824
-0.023
-0.34%
1 Jan 1987 Jahr
6.797
-0.027
-0.4%
1 Jan 1988 Jahr
6.765
-0.032
-0.47%
1 Jan 1989 Jahr
6.728
-0.037
-0.55%
1 Jan 1990 Jahr
6.685
-0.043
-0.64%
1 Jan 1991 Jahr
6.638
-0.047
-0.7%
1 Jan 1992 Jahr
6.587
-0.051
-0.77%
1 Jan 1993 Jahr
6.535
-0.052
-0.78%
1 Jan 1994 Jahr
6.484
-0.052
-0.79%
1 Jan 1995 Jahr
6.432
-0.051
-0.79%
1 Jan 1996 Jahr
6.38
-0.052
-0.8%
1 Jan 1997 Jahr
6.327
-0.054
-0.84%
1 Jan 1998 Jahr
6.27
-0.056
-0.89%
1 Jan 1999 Jahr
6.211
-0.059
-0.94%
1 Jan 2000 Jahr
6.15
-0.062
-0.99%
1 Jan 2001 Jahr
6.086
-0.064
-1.04%
1 Jan 2002 Jahr
6.018
-0.068
-1.11%
1 Jan 2003 Jahr
5.948
-0.07
-1.16%
1 Jan 2004 Jahr
5.876
-0.072
-1.22%
1 Jan 2005 Jahr
5.801
-0.075
-1.28%
1 Jan 2006 Jahr
5.723
-0.078
-1.34%
1 Jan 2007 Jahr
5.642
-0.081
-1.42%
1 Jan 2008 Jahr
5.559
-0.083
-1.47%
1 Jan 2009 Jahr
5.474
-0.084
-1.52%
1 Jan 2010 Jahr
5.389
-0.085
-1.55%
1 Jan 2011 Jahr
5.304
-0.085
-1.58%
1 Jan 2012 Jahr
5.219
-0.085
-1.61%
1 Jan 2013 Jahr
5.134
-0.085
-1.63%
1 Jan 2014 Jahr
5.049
-0.084
-1.64%
1 Jan 2015 Jahr
4.966
-0.083
-1.65%
Bewertung der Länder gemäß mit laufender Statistik nach Jahren


Kommentare: