29
/de/
de
AIzaSyAYiBZKx7MnpbEhh9jyipgxe19OcubqV5w
April 1, 2024
24066
Arab World
ARB
false
2
1
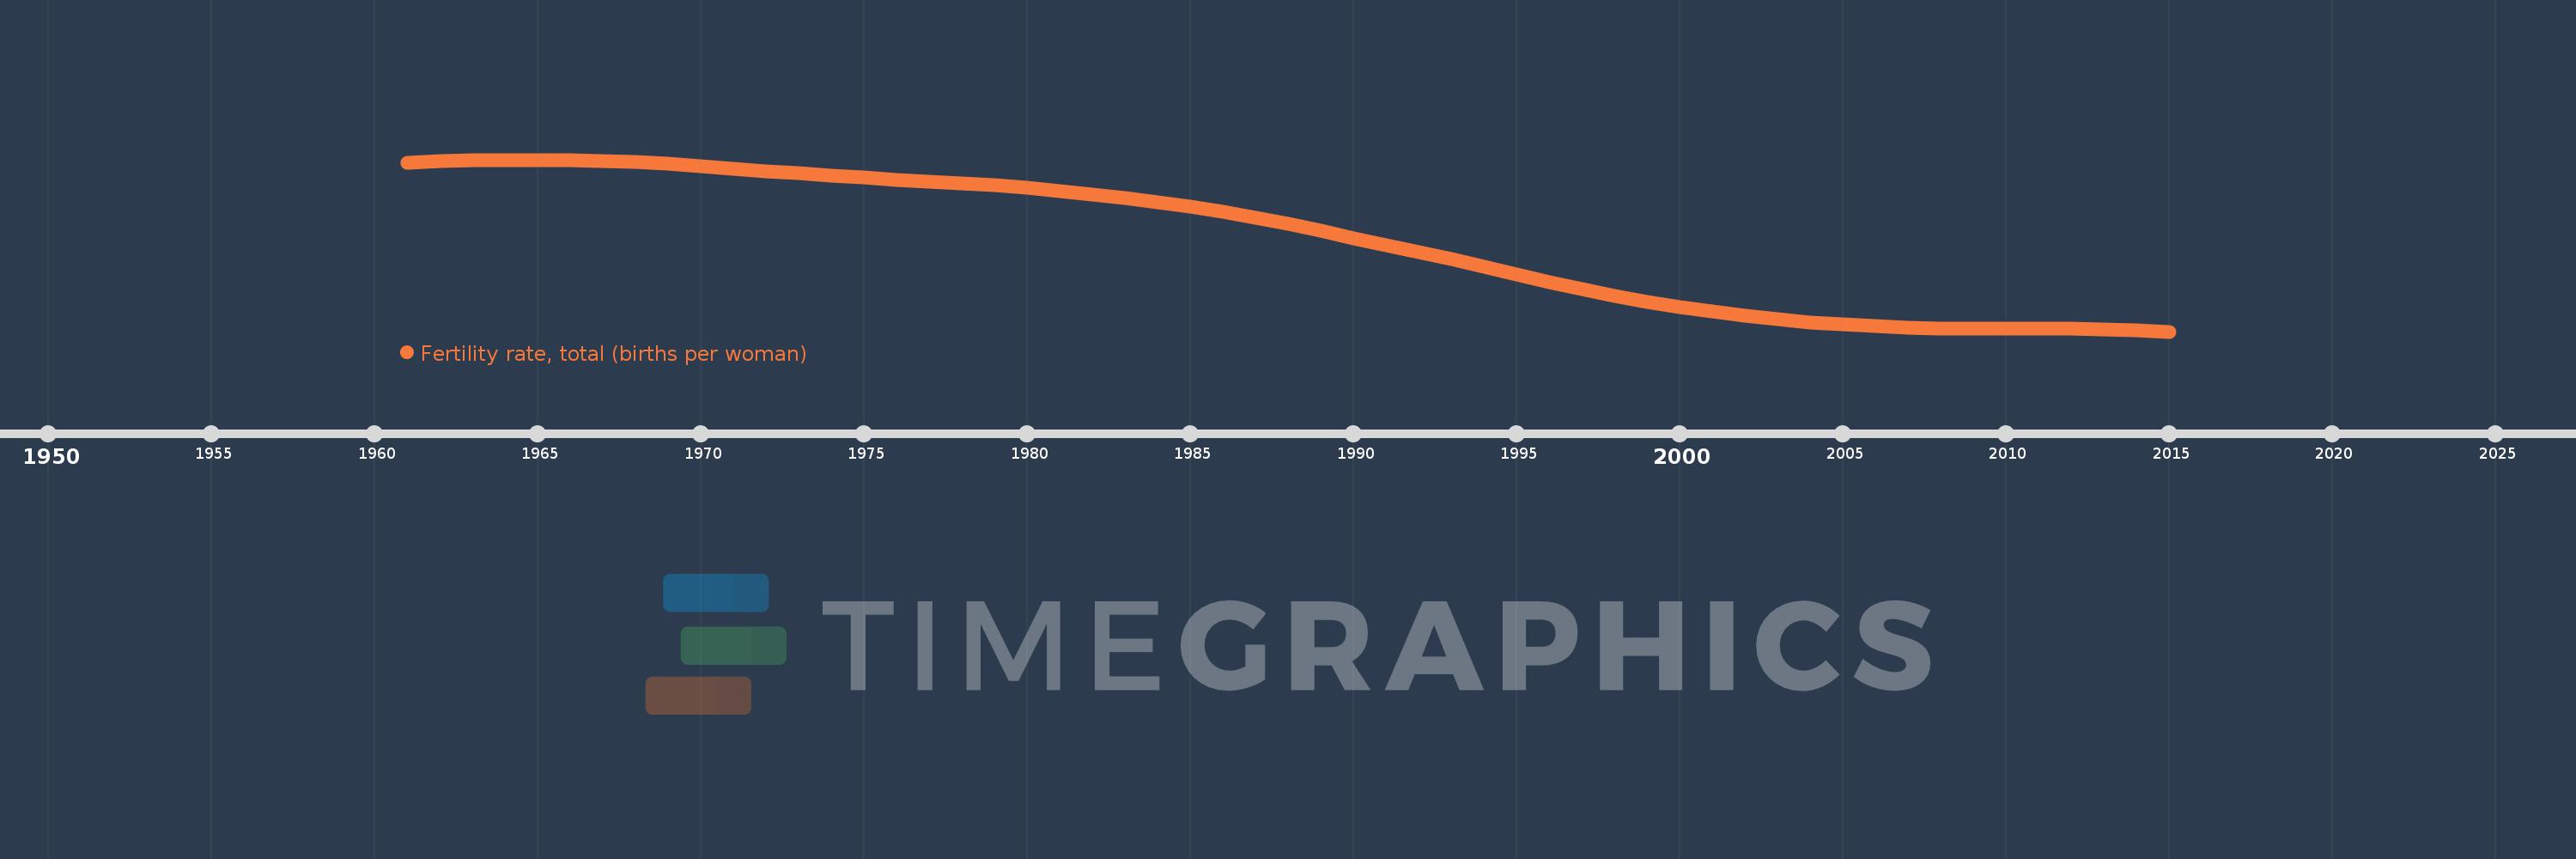
Fertility rate, total (births per woman)
2015,2014,2013,2012,2011,2010,2009,2008,2007,2006,2005,2004,2003,2002,2001,2000,1999,1998,1997,1996,1995,1994,1993,1992,1991,1990,1989,1988,1987,1986,1985,1984,1983,1982,1981,1980,1979,1978,1977,1976,1975,1974,1973,1972,1971,1970,1969,1968,1967,1966,1965,1964,1963,1962,1961
Diese Statistik in anderen Ländern:
AfghanistanAlbaniaAlgeriaAndorraAngolaAntigua and BarbudaArab WorldArgentinaArmeniaArubaAustraliaAustriaAzerbaijanBahamas, TheBahrainBangladeshBarbadosBelarusBelgiumBelizeBeninBermudaBhutanBoliviaBosnia and HerzegovinaBotswanaBrazilBrunei DarussalamBulgariaBurkina FasoBurundiCabo VerdeCambodiaCameroonCanadaCaribbean small statesCentral African RepublicCentral Europe and the BalticsChadChannel IslandsChileChinaColombiaComorosCongo, Dem. Rep.Congo, Rep.Costa RicaCote d'IvoireCroatiaCubaCuracaoCyprusCzech RepublicDenmarkDjiboutiDominicaDominican RepublicEarly-demographic dividendEast Asia & PacificEast Asia & Pacific (excluding high income)East Asia & Pacific (IDA & IBRD countries)EcuadorEgypt, Arab Rep.El SalvadorEquatorial GuineaEritreaEstoniaEthiopiaEuro areaEurope & Central AsiaEurope & Central Asia (excluding high income)Europe & Central Asia (IDA & IBRD countries)European UnionFaroe IslandsFijiFinlandFragile and conflict affected situationsFranceFrench PolynesiaGabonGambia, TheGeorgiaGermanyGhanaGreeceGreenlandGrenadaGuamGuatemalaGuineaGuinea-BissauGuyanaHaitiHeavily indebted poor countries (HIPC)High incomeHondurasHong Kong SAR, ChinaHungaryIBRD onlyIcelandIDA & IBRD totalIDA blendIDA onlyIDA totalIndiaIndonesiaIran, Islamic Rep.IraqIrelandIsle of ManIsraelItalyJamaicaJapanJordanKazakhstanKenyaKiribatiKorea, Dem. People’s Rep.Korea, Rep.KosovoKuwaitKyrgyz RepublicLao PDRLate-demographic dividendLatin America & Caribbean Latin America & Caribbean (excluding high income)Latin America & the Caribbean (IDA & IBRD countries)LatviaLeast developed countries: UN classificationLebanonLesothoLiberiaLibyaLiechtensteinLithuaniaLow & middle incomeLow incomeLower middle incomeLuxembourgMacao SAR, ChinaMacedonia, FYRMadagascarMalawiMalaysiaMaldivesMaliMaltaMarshall IslandsMauritaniaMauritiusMexicoMicronesia, Fed. Sts.Middle East & North AfricaMiddle East & North Africa (excluding high income)Middle East & North Africa (IDA & IBRD countries)Middle incomeMoldovaMongoliaMontenegroMoroccoMozambiqueMyanmarNamibiaNepalNetherlandsNew CaledoniaNew ZealandNicaraguaNigerNigeriaNorth AmericaNorwayOECD membersOmanOther small statesPacific island small statesPakistanPalauPanamaPapua New GuineaParaguayPeruPhilippinesPolandPortugalPost-demographic dividendPre-demographic dividendPuerto RicoQatarRomaniaRussian FederationRwandaSamoaSan MarinoSao Tome and PrincipeSaudi ArabiaSenegalSerbiaSeychellesSierra LeoneSingaporeSint Maarten (Dutch part)Slovak RepublicSloveniaSmall statesSolomon IslandsSomaliaSouth AfricaSouth AsiaSouth Asia (IDA & IBRD)South SudanSpainSri LankaSt. Kitts and NevisSt. LuciaSt. Martin (French part)St. Vincent and the GrenadinesSub-Saharan Africa Sub-Saharan Africa (excluding high income)Sub-Saharan Africa (IDA & IBRD countries)SudanSurinameSwazilandSwedenSwitzerlandSyrian Arab RepublicTajikistanTanzaniaThailandTimor-LesteTogoTongaTrinidad and TobagoTunisiaTurkeyTurkmenistanUgandaUkraineUnited Arab EmiratesUnited KingdomUnited StatesUpper middle incomeUruguayUzbekistanVanuatuVenezuela, RBVietnamVirgin Islands (U.S.)West Bank and GazaWorldYemen, Rep.ZambiaZimbabwe Zeitlinie:
Diese Zeitleiste vorliegt die Graphik ab 1961 J. bis 2015 J. Arab World. Die Angaben bis 1960 J. sind nicht vorhanden. Die Zahl aktueller Beobachtungen nach Daten: 55.
Die Quelle (Bezeichnung):
Kennzahlen der Weltentwicklung
Die Quelle (Einrichtung):
(1) United Nations Population Division. World Population Prospects, (2) Census reports and other statistical publications from national statistical offices, (3) Eurostat: Demographic Statistics, (4) United Nations Statistical Division. Population and Vital Statistics Reprot (various years), (5) U.S. Census Bureau: International Database, and (6) Secretariat of the Pacific Community: Statistics and Demography Programme.
Kategorien:
Health, Gender
Es wurde aktualisiert:
23 Apr 2017 Jahr
Kennzahlen der Wertänderungen vom Jahr zum Jahr
Minimum:
3.375
1 Jan 2015 Jahr
Maximum:
6.979
1 Jan 1965 Jahr
Zum Datum der Beobachtung
Wert
Absolute Veränderung
Die Veränderung bezüglich dem vorherigen Wert
1 Jan 1961 Jahr
6.924
+6.924
0.0%
1 Jan 1962 Jahr
6.946
+0.022
0.32%
1 Jan 1963 Jahr
6.964
+0.018
0.26%
1 Jan 1964 Jahr
6.976
+0.011
0.16%
1 Jan 1965 Jahr
6.979
+0.003
0.04%
1 Jan 1966 Jahr
6.972
-0.007
-0.09%
1 Jan 1967 Jahr
6.954
-0.018
-0.26%
1 Jan 1968 Jahr
6.926
-0.028
-0.4%
1 Jan 1969 Jahr
6.89
-0.036
-0.53%
1 Jan 1970 Jahr
6.845
-0.044
-0.64%
1 Jan 1971 Jahr
6.796
-0.05
-0.72%
1 Jan 1972 Jahr
6.744
-0.052
-0.76%
1 Jan 1973 Jahr
6.694
-0.05
-0.74%
1 Jan 1974 Jahr
6.647
-0.047
-0.71%
1 Jan 1975 Jahr
6.603
-0.044
-0.66%
1 Jan 1976 Jahr
6.563
-0.04
-0.61%
1 Jan 1977 Jahr
6.525
-0.038
-0.58%
1 Jan 1978 Jahr
6.485
-0.04
-0.61%
1 Jan 1979 Jahr
6.44
-0.045
-0.69%
1 Jan 1980 Jahr
6.388
-0.052
-0.8%
1 Jan 1981 Jahr
6.327
-0.061
-0.95%
1 Jan 1982 Jahr
6.258
-0.07
-1.1%
1 Jan 1983 Jahr
6.178
-0.08
-1.27%
1 Jan 1984 Jahr
6.09
-0.088
-1.43%
1 Jan 1985 Jahr
5.992
-0.098
-1.6%
1 Jan 1986 Jahr
5.884
-0.108
-1.81%
1 Jan 1987 Jahr
5.762
-0.122
-2.08%
1 Jan 1988 Jahr
5.628
-0.133
-2.32%
1 Jan 1989 Jahr
5.485
-0.143
-2.54%
1 Jan 1990 Jahr
5.335
-0.15
-2.74%
1 Jan 1991 Jahr
5.186
-0.149
-2.8%
1 Jan 1992 Jahr
5.033
-0.153
-2.95%
1 Jan 1993 Jahr
4.903
-0.13
-2.59%
1 Jan 1994 Jahr
4.741
-0.161
-3.28%
1 Jan 1995 Jahr
4.579
-0.162
-3.42%
1 Jan 1996 Jahr
4.411
-0.168
-3.68%
1 Jan 1997 Jahr
4.266
-0.145
-3.29%
1 Jan 1998 Jahr
4.131
-0.135
-3.18%
1 Jan 1999 Jahr
4.004
-0.127
-3.07%
1 Jan 2000 Jahr
3.889
-0.115
-2.88%
1 Jan 2001 Jahr
3.791
-0.097
-2.5%
1 Jan 2002 Jahr
3.705
-0.086
-2.26%
1 Jan 2003 Jahr
3.631
-0.074
-2.0%
1 Jan 2004 Jahr
3.573
-0.058
-1.6%
1 Jan 2005 Jahr
3.522
-0.051
-1.42%
1 Jan 2006 Jahr
3.485
-0.037
-1.06%
1 Jan 2007 Jahr
3.458
-0.027
-0.77%
1 Jan 2008 Jahr
3.443
-0.015
-0.44%
1 Jan 2009 Jahr
3.437
-0.006
-0.18%
1 Jan 2010 Jahr
3.435
-0.002
-0.05%
1 Jan 2011 Jahr
3.437
+0.002
0.06%
1 Jan 2012 Jahr
3.434
-0.003
-0.09%
1 Jan 2013 Jahr
3.425
-0.009
-0.26%
1 Jan 2014 Jahr
3.405
-0.02
-0.58%
1 Jan 2015 Jahr
3.375
-0.03
-0.89%
Bewertung der Länder gemäß mit laufender Statistik nach Jahren


Kommentare: