29
/de/
de
AIzaSyAYiBZKx7MnpbEhh9jyipgxe19OcubqV5w
April 1, 2024
34439
Fragile and conflict affected situations
FCS
false
2
1
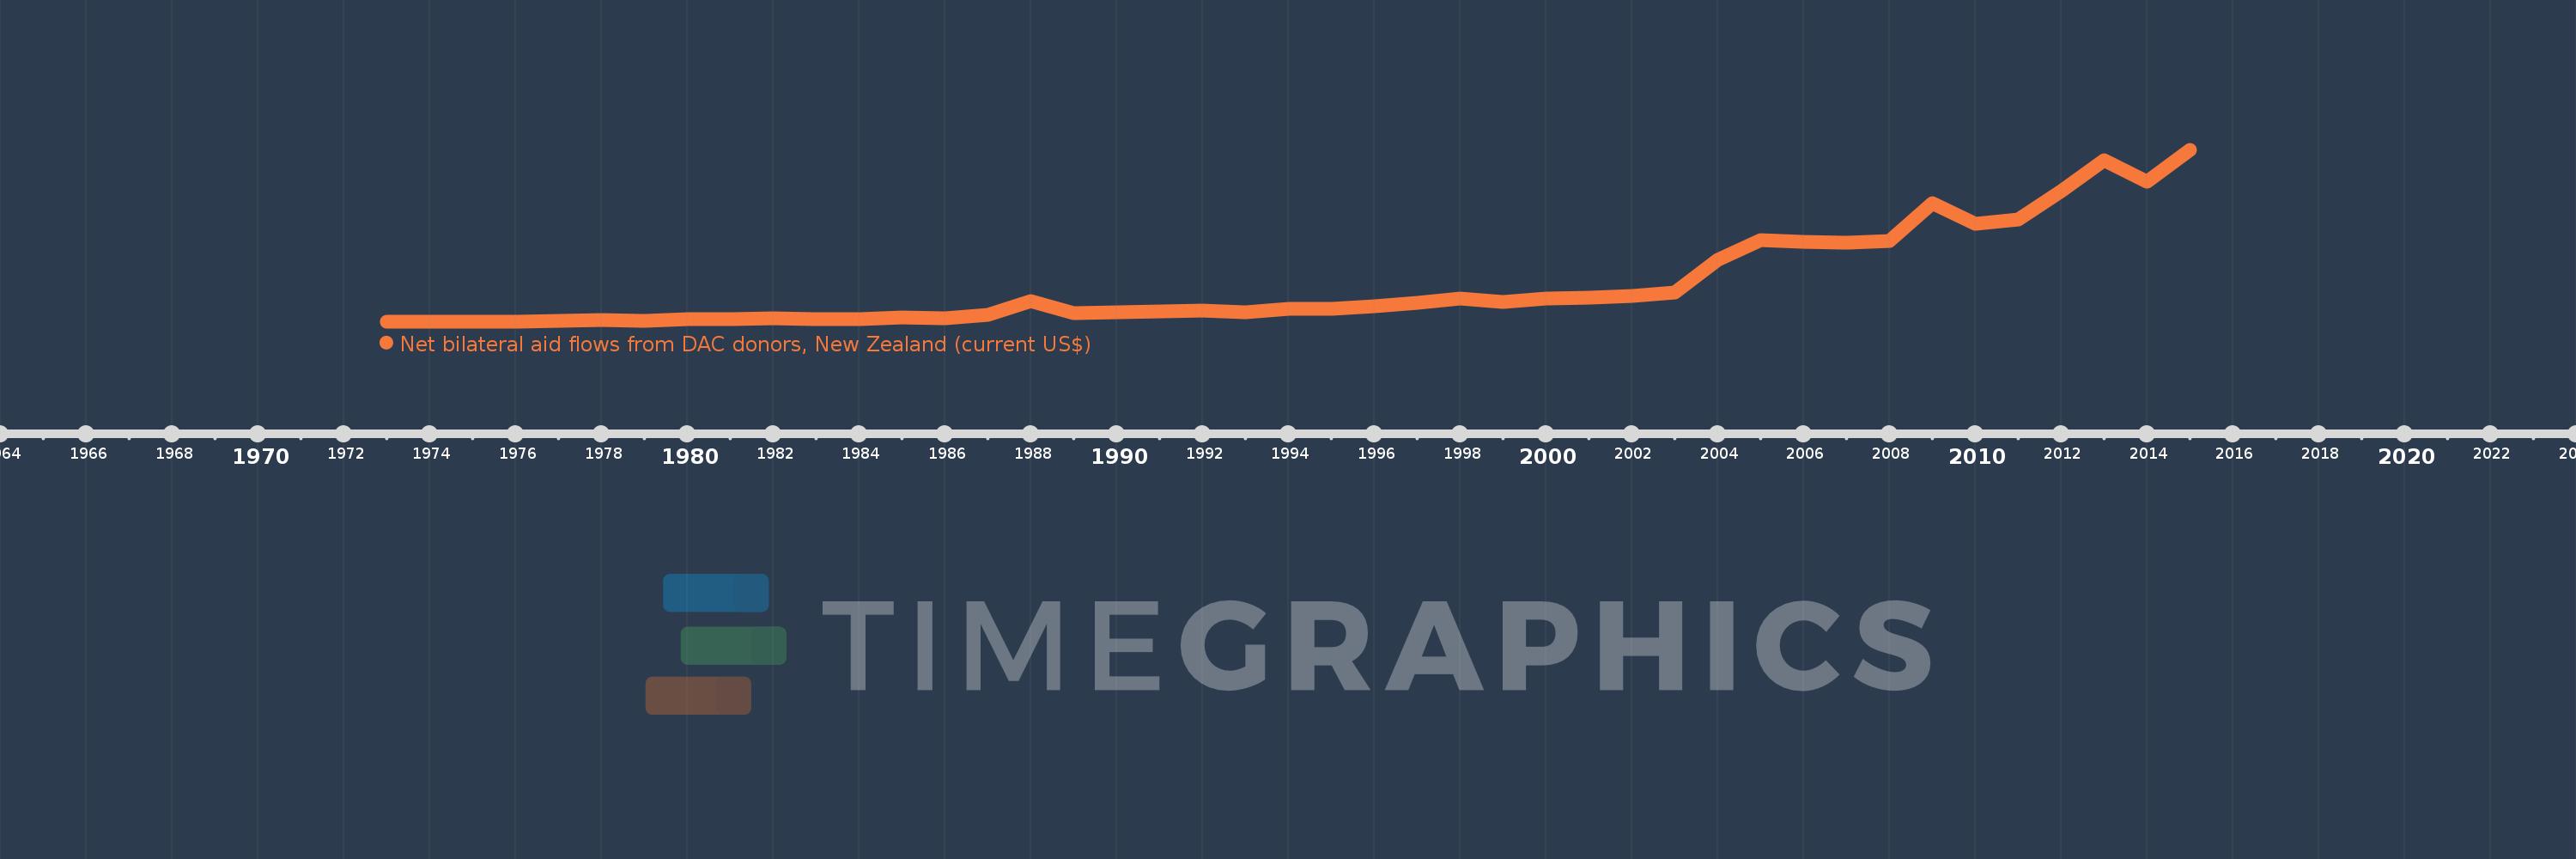
Net bilateral aid flows from DAC donors, New Zealand (current US$)
2015,2014,2013,2012,2011,2010,2009,2008,2007,2006,2005,2004,2003,2002,2001,2000,1999,1998,1997,1996,1995,1994,1993,1992,1991,1990,1989,1988,1987,1986,1985,1984,1983,1982,1981,1980,1979,1978,1977,1976,1975,1974,1973
Diese Statistik in anderen Ländern:
AfghanistanAlgeriaAngolaAntigua and BarbudaArab WorldArgentinaBahamas, TheBangladeshBarbadosBelizeBeninBhutanBoliviaBosnia and HerzegovinaBotswanaBrazilBrunei DarussalamBurkina FasoBurundiCambodiaCameroonCaribbean small statesCentral African RepublicCentral Europe and the BalticsChadChileChinaColombiaComorosCongo, Dem. Rep.Costa RicaCote d'IvoireCyprusCzech RepublicDjiboutiDominicaEast Asia & PacificEast Asia & Pacific (excluding high income)East Asia & Pacific (IDA & IBRD countries)EcuadorEgypt, Arab Rep.El SalvadorEritreaEthiopiaEuro areaEurope & Central AsiaEurope & Central Asia (excluding high income)Europe & Central Asia (IDA & IBRD countries)European UnionFijiFragile and conflict affected situationsFrench PolynesiaGambia, TheGhanaGrenadaGuatemalaGuinea-BissauGuyanaHaitiHeavily indebted poor countries (HIPC)High incomeHondurasHong Kong SAR, ChinaHungaryIBRD onlyIDA & IBRD totalIDA blendIDA onlyIDA totalIndiaIndonesiaIran, Islamic Rep.IraqIsraelJamaicaJordanKazakhstanKenyaKiribatiKorea, Dem. People’s Rep.Korea, Rep.KuwaitKyrgyz RepublicLao PDRLatin America & Caribbean Latin America & Caribbean (excluding high income)Latin America & the Caribbean (IDA & IBRD countries)Least developed countries: UN classificationLebanonLesothoLiberiaLibyaLow & middle incomeLow incomeLower middle incomeMadagascarMalawiMalaysiaMaldivesMaliMaltaMarshall IslandsMauritaniaMauritiusMexicoMicronesia, Fed. Sts.Middle East & North AfricaMiddle East & North Africa (excluding high income)Middle East & North Africa (IDA & IBRD countries)Middle incomeMongoliaMoroccoMozambiqueMyanmarNamibiaNauruNepalNew CaledoniaNicaraguaNigerNigeriaNorthern Mariana IslandsOECD membersOther small statesPacific island small statesPakistanPalauPapua New GuineaParaguayPeruPhilippinesRussian FederationRwandaSamoaSenegalSerbiaSeychellesSierra LeoneSingaporeSlovak RepublicSmall statesSolomon IslandsSomaliaSouth AfricaSouth AsiaSouth Asia (IDA & IBRD)South SudanSri LankaSt. LuciaSt. Vincent and the GrenadinesSub-Saharan Africa Sub-Saharan Africa (excluding high income)Sub-Saharan Africa (IDA & IBRD countries)SudanSurinameSwazilandSyrian Arab RepublicTajikistanTanzaniaThailandTimor-LesteTongaTrinidad and TobagoTunisiaTurkeyTurkmenistanTuvaluUgandaUpper middle incomeUruguayUzbekistanVanuatuVenezuela, RBVietnamWest Bank and GazaWorldYemen, Rep.ZambiaZimbabwe Zeitlinie:
Diese Zeitleiste vorliegt die Graphik ab 1973 J. bis 2015 J. Fragile and conflict affected situations. Die Angaben bis 1972 J. sind nicht vorhanden. Die Zahl aktueller Beobachtungen nach Daten: 43.
Die Quelle (Bezeichnung):
Kennzahlen der Weltentwicklung
Die Quelle (Einrichtung):
Development Assistance Committee of the Organisation for Economic Co-operation and Development, Geographical Distribution of Financial Flows to Developing Countries, Development Co-operation Report, and International Development Statistics database. Data are available online at: www.oecd.org/dac/stats/idsonline.
Kategorien:
Aid Effectiveness
Es wurde aktualisiert:
23 Apr 2017 Jahr
Kennzahlen der Wertänderungen vom Jahr zum Jahr
im Durchschnitt:
17.904 Mln.
Minimum:
160.0 Tsnd.
1 Jan 1975 Jahr
Maximum:
80.98 Mln.
1 Jan 2015 Jahr
Zum Datum der Beobachtung
Wert
Absolute Veränderung
Die Veränderung bezüglich dem vorherigen Wert
1 Jan 1973 Jahr
300.0 Tsnd.
+300.0 Tsnd.
0.0%
1 Jan 1974 Jahr
170.0 Tsnd.
-130.0 Tsnd.
-43.33%
1 Jan 1975 Jahr
160.0 Tsnd.
-10.0 Tsnd.
-5.88%
1 Jan 1976 Jahr
230.0 Tsnd.
+70.0 Tsnd.
43.75%
1 Jan 1977 Jahr
590.0 Tsnd.
+360.0 Tsnd.
156.52%
1 Jan 1978 Jahr
950.0 Tsnd.
+360.0 Tsnd.
61.02%
1 Jan 1979 Jahr
780.0 Tsnd.
-170.0 Tsnd.
-17.89%
1 Jan 1980 Jahr
1.35 Mln.
+570.0 Tsnd.
73.08%
1 Jan 1981 Jahr
1.39 Mln.
+40.0 Tsnd.
2.96%
1 Jan 1982 Jahr
1.75 Mln.
+360.0 Tsnd.
25.9%
1 Jan 1983 Jahr
1.34 Mln.
-410.0 Tsnd.
-23.43%
1 Jan 1984 Jahr
1.4 Mln.
+60.0 Tsnd.
4.48%
1 Jan 1985 Jahr
2.29 Mln.
+890.0 Tsnd.
63.57%
1 Jan 1986 Jahr
1.91 Mln.
-380.0 Tsnd.
-16.59%
1 Jan 1987 Jahr
3.56 Mln.
+1.65 Mln.
86.39%
1 Jan 1988 Jahr
9.9 Mln.
+6.34 Mln.
178.09%
1 Jan 1989 Jahr
4.39 Mln.
-5.51 Mln.
-55.66%
1 Jan 1990 Jahr
4.88 Mln.
+490.0 Tsnd.
11.16%
1 Jan 1991 Jahr
5.03 Mln.
+150.0 Tsnd.
3.07%
1 Jan 1992 Jahr
5.49 Mln.
+460.0 Tsnd.
9.15%
1 Jan 1993 Jahr
4.66 Mln.
-830.0 Tsnd.
-15.12%
1 Jan 1994 Jahr
6.36 Mln.
+1.7 Mln.
36.48%
1 Jan 1995 Jahr
6.25 Mln.
-110.0 Tsnd.
-1.73%
1 Jan 1996 Jahr
7.73 Mln.
+1.48 Mln.
23.68%
1 Jan 1997 Jahr
9.3 Mln.
+1.57 Mln.
20.31%
1 Jan 1998 Jahr
11.09 Mln.
+1.79 Mln.
19.25%
1 Jan 1999 Jahr
9.39 Mln.
-1.7 Mln.
-15.33%
1 Jan 2000 Jahr
11.17 Mln.
+1.78 Mln.
18.96%
1 Jan 2001 Jahr
11.42 Mln.
+250.0 Tsnd.
2.24%
1 Jan 2002 Jahr
12.54 Mln.
+1.12 Mln.
9.81%
1 Jan 2003 Jahr
14.16 Mln.
+1.62 Mln.
12.92%
1 Jan 2004 Jahr
29.38 Mln.
+15.22 Mln.
107.49%
1 Jan 2005 Jahr
38.61 Mln.
+9.23 Mln.
31.42%
1 Jan 2006 Jahr
37.92 Mln.
-690.0 Tsnd.
-1.79%
1 Jan 2007 Jahr
37.54 Mln.
-380.0 Tsnd.
-1.0%
1 Jan 2008 Jahr
38.24 Mln.
+700.0 Tsnd.
1.86%
1 Jan 2009 Jahr
55.89 Mln.
+17.65 Mln.
46.16%
1 Jan 2010 Jahr
46.51 Mln.
-9.38 Mln.
-16.78%
1 Jan 2011 Jahr
48.38 Mln.
+1.87 Mln.
4.02%
1 Jan 2012 Jahr
61.89 Mln.
+13.51 Mln.
27.92%
1 Jan 2013 Jahr
76.43 Mln.
+14.54 Mln.
23.49%
1 Jan 2014 Jahr
66.18 Mln.
-10.25 Mln.
-13.41%
1 Jan 2015 Jahr
80.98 Mln.
+14.8 Mln.
22.36%
Bewertung der Länder gemäß mit laufender Statistik nach Jahren


Kommentare: