29
/de/
de
AIzaSyAYiBZKx7MnpbEhh9jyipgxe19OcubqV5w
April 1, 2024
244810
Somalia
SOM
true
2
1
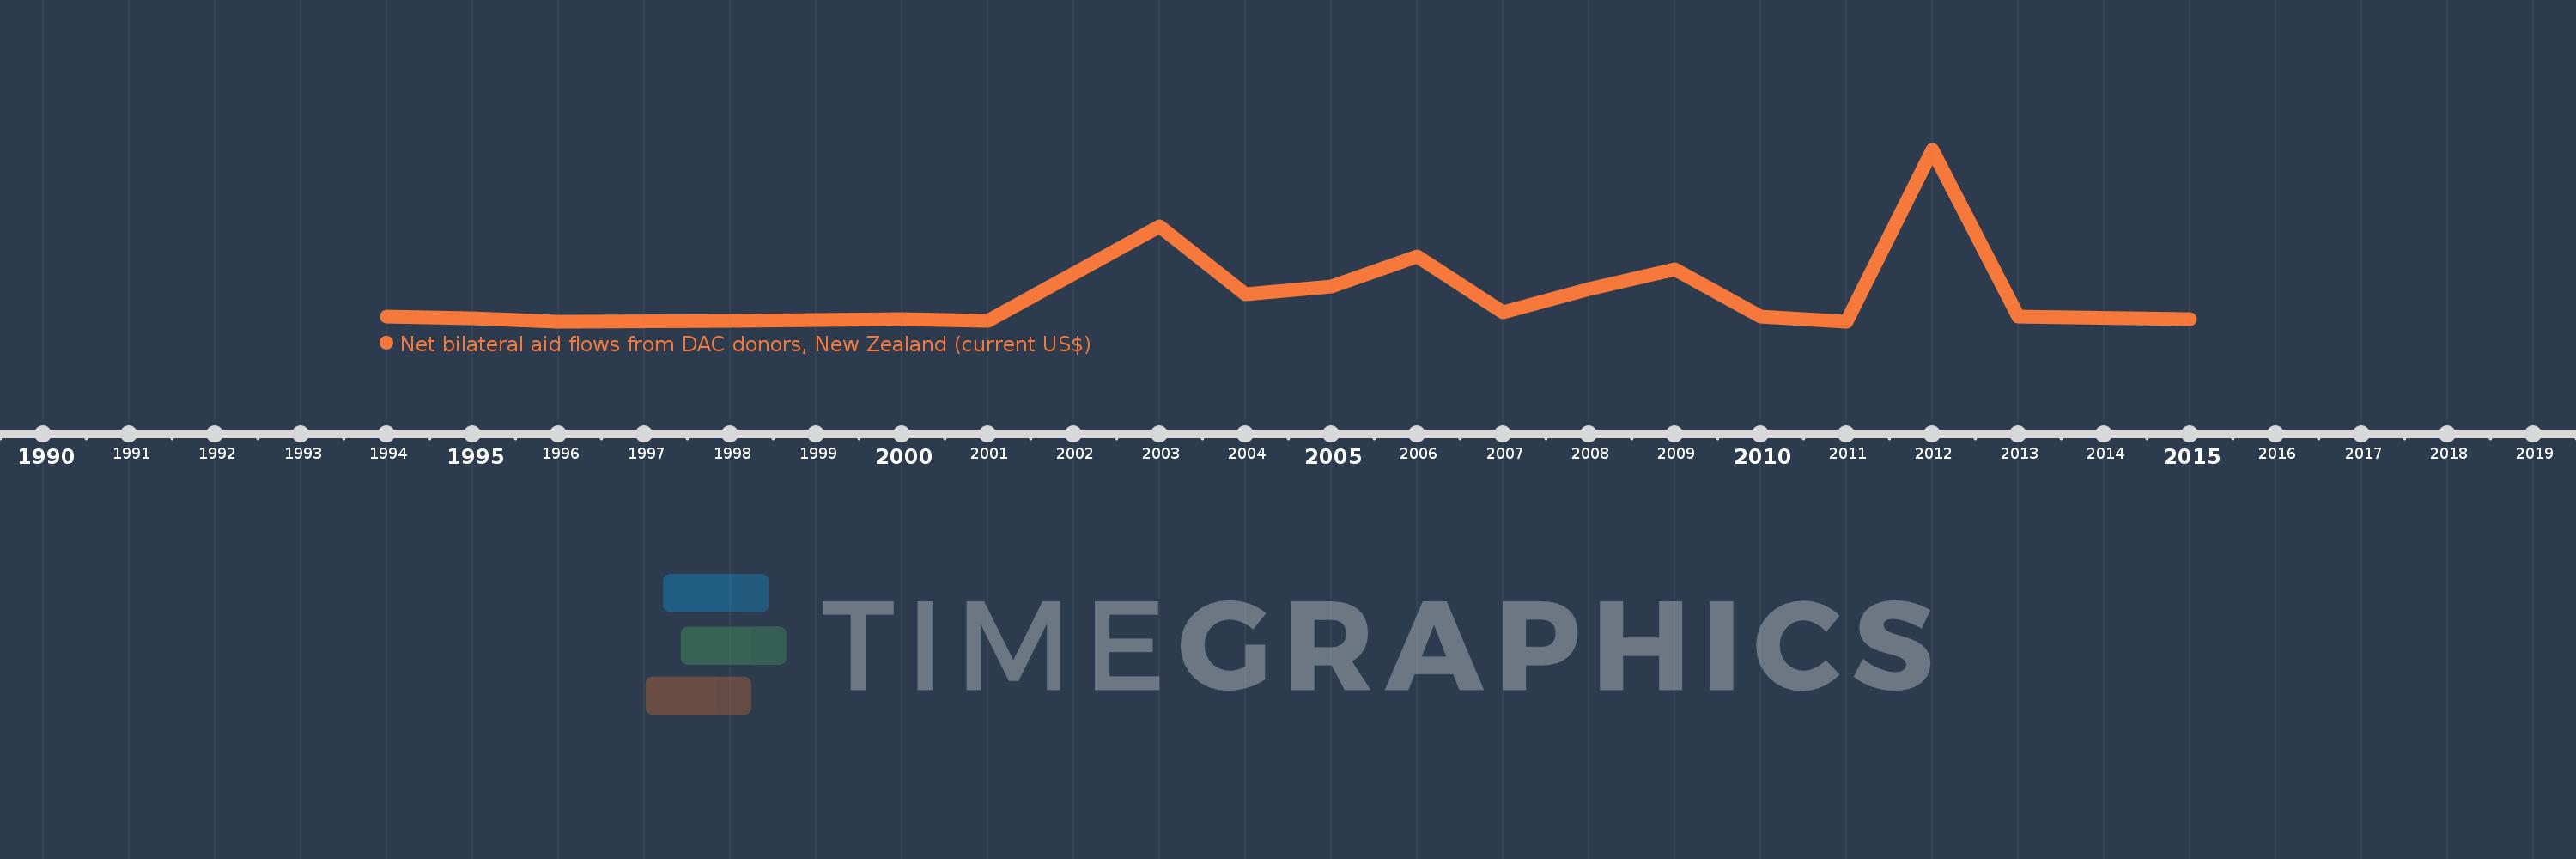
Net bilateral aid flows from DAC donors, New Zealand (current US$)
2015,2013,2012,2011,2010,2009,2008,2007,2006,2005,2004,2003,2001,2000,1998,1996,1995,1994
Diese Statistik in anderen Ländern:
AfghanistanAlgeriaAngolaAntigua and BarbudaArab WorldArgentinaBahamas, TheBangladeshBarbadosBelizeBeninBhutanBoliviaBosnia and HerzegovinaBotswanaBrazilBrunei DarussalamBurkina FasoBurundiCambodiaCameroonCaribbean small statesCentral African RepublicCentral Europe and the BalticsChadChileChinaColombiaComorosCongo, Dem. Rep.Costa RicaCote d'IvoireCyprusCzech RepublicDjiboutiDominicaEast Asia & PacificEast Asia & Pacific (excluding high income)East Asia & Pacific (IDA & IBRD countries)EcuadorEgypt, Arab Rep.El SalvadorEritreaEthiopiaEuro areaEurope & Central AsiaEurope & Central Asia (excluding high income)Europe & Central Asia (IDA & IBRD countries)European UnionFijiFragile and conflict affected situationsFrench PolynesiaGambia, TheGhanaGrenadaGuatemalaGuinea-BissauGuyanaHaitiHeavily indebted poor countries (HIPC)High incomeHondurasHong Kong SAR, ChinaHungaryIBRD onlyIDA & IBRD totalIDA blendIDA onlyIDA totalIndiaIndonesiaIran, Islamic Rep.IraqIsraelJamaicaJordanKazakhstanKenyaKiribatiKorea, Dem. People’s Rep.Korea, Rep.KuwaitKyrgyz RepublicLao PDRLatin America & Caribbean Latin America & Caribbean (excluding high income)Latin America & the Caribbean (IDA & IBRD countries)Least developed countries: UN classificationLebanonLesothoLiberiaLibyaLow & middle incomeLow incomeLower middle incomeMadagascarMalawiMalaysiaMaldivesMaliMaltaMarshall IslandsMauritaniaMauritiusMexicoMicronesia, Fed. Sts.Middle East & North AfricaMiddle East & North Africa (excluding high income)Middle East & North Africa (IDA & IBRD countries)Middle incomeMongoliaMoroccoMozambiqueMyanmarNamibiaNauruNepalNew CaledoniaNicaraguaNigerNigeriaNorthern Mariana IslandsOECD membersOther small statesPacific island small statesPakistanPalauPapua New GuineaParaguayPeruPhilippinesRussian FederationRwandaSamoaSenegalSerbiaSeychellesSierra LeoneSingaporeSlovak RepublicSmall statesSolomon IslandsSomaliaSouth AfricaSouth AsiaSouth Asia (IDA & IBRD)South SudanSri LankaSt. LuciaSt. Vincent and the GrenadinesSub-Saharan Africa Sub-Saharan Africa (excluding high income)Sub-Saharan Africa (IDA & IBRD countries)SudanSurinameSwazilandSyrian Arab RepublicTajikistanTanzaniaThailandTimor-LesteTongaTrinidad and TobagoTunisiaTurkeyTurkmenistanTuvaluUgandaUpper middle incomeUruguayUzbekistanVanuatuVenezuela, RBVietnamWest Bank and GazaWorldYemen, Rep.ZambiaZimbabwe Zeitlinie:
Diese Zeitleiste vorliegt die Graphik ab 1994 J. bis 2015 J. Somalia. Die Angaben bis 1993 J. sind nicht vorhanden. Die Zahl aktueller Beobachtungen nach Daten: 18.
Die Quelle (Bezeichnung):
Kennzahlen der Weltentwicklung
Die Quelle (Einrichtung):
Development Assistance Committee of the Organisation for Economic Co-operation and Development, Geographical Distribution of Financial Flows to Developing Countries, Development Co-operation Report, and International Development Statistics database. Data are available online at: www.oecd.org/dac/stats/idsonline.
Kategorien:
Aid Effectiveness
Es wurde aktualisiert:
23 Apr 2017 Jahr
Kennzahlen der Wertänderungen vom Jahr zum Jahr
im Durchschnitt:
453.333 Tsnd.
Minimum:
30.0 Tsnd.
1 Jan 1996 Jahr
Maximum:
2.55 Mln.
1 Jan 2012 Jahr
Zum Datum der Beobachtung
Wert
Absolute Veränderung
Die Veränderung bezüglich dem vorherigen Wert
1 Jan 1994 Jahr
110.0 Tsnd.
+110.0 Tsnd.
0.0%
1 Jan 1995 Jahr
80.0 Tsnd.
-30.0 Tsnd.
-27.27%
1 Jan 1996 Jahr
30.0 Tsnd.
-50.0 Tsnd.
-62.5%
1 Jan 1998 Jahr
50.0 Tsnd.
+20.0 Tsnd.
66.67%
1 Jan 2000 Jahr
70.0 Tsnd.
+20.0 Tsnd.
40.0%
1 Jan 2001 Jahr
50.0 Tsnd.
-20.0 Tsnd.
-28.57%
1 Jan 2003 Jahr
1.43 Mln.
+1.38 Mln.
2.76 Tsnd.%
1 Jan 2004 Jahr
440.0 Tsnd.
-990.0 Tsnd.
-69.23%
1 Jan 2005 Jahr
550.0 Tsnd.
+110.0 Tsnd.
25.0%
1 Jan 2006 Jahr
990.0 Tsnd.
+440.0 Tsnd.
80.0%
1 Jan 2007 Jahr
170.0 Tsnd.
-820.0 Tsnd.
-82.83%
1 Jan 2008 Jahr
510.0 Tsnd.
+340.0 Tsnd.
200.0%
1 Jan 2009 Jahr
800.0 Tsnd.
+290.0 Tsnd.
56.86%
1 Jan 2010 Jahr
110.0 Tsnd.
-690.0 Tsnd.
-86.25%
1 Jan 2011 Jahr
40.0 Tsnd.
-70.0 Tsnd.
-63.64%
1 Jan 2012 Jahr
2.55 Mln.
+2.51 Mln.
6.28 Tsnd.%
1 Jan 2013 Jahr
110.0 Tsnd.
-2.44 Mln.
-95.69%
1 Jan 2015 Jahr
70.0 Tsnd.
-40.0 Tsnd.
-36.36%
Bewertung der Länder gemäß mit laufender Statistik nach Jahren


Kommentare: