29
/de/
de
AIzaSyAYiBZKx7MnpbEhh9jyipgxe19OcubqV5w
April 1, 2024
33520
European Union
EUU
false
2
1
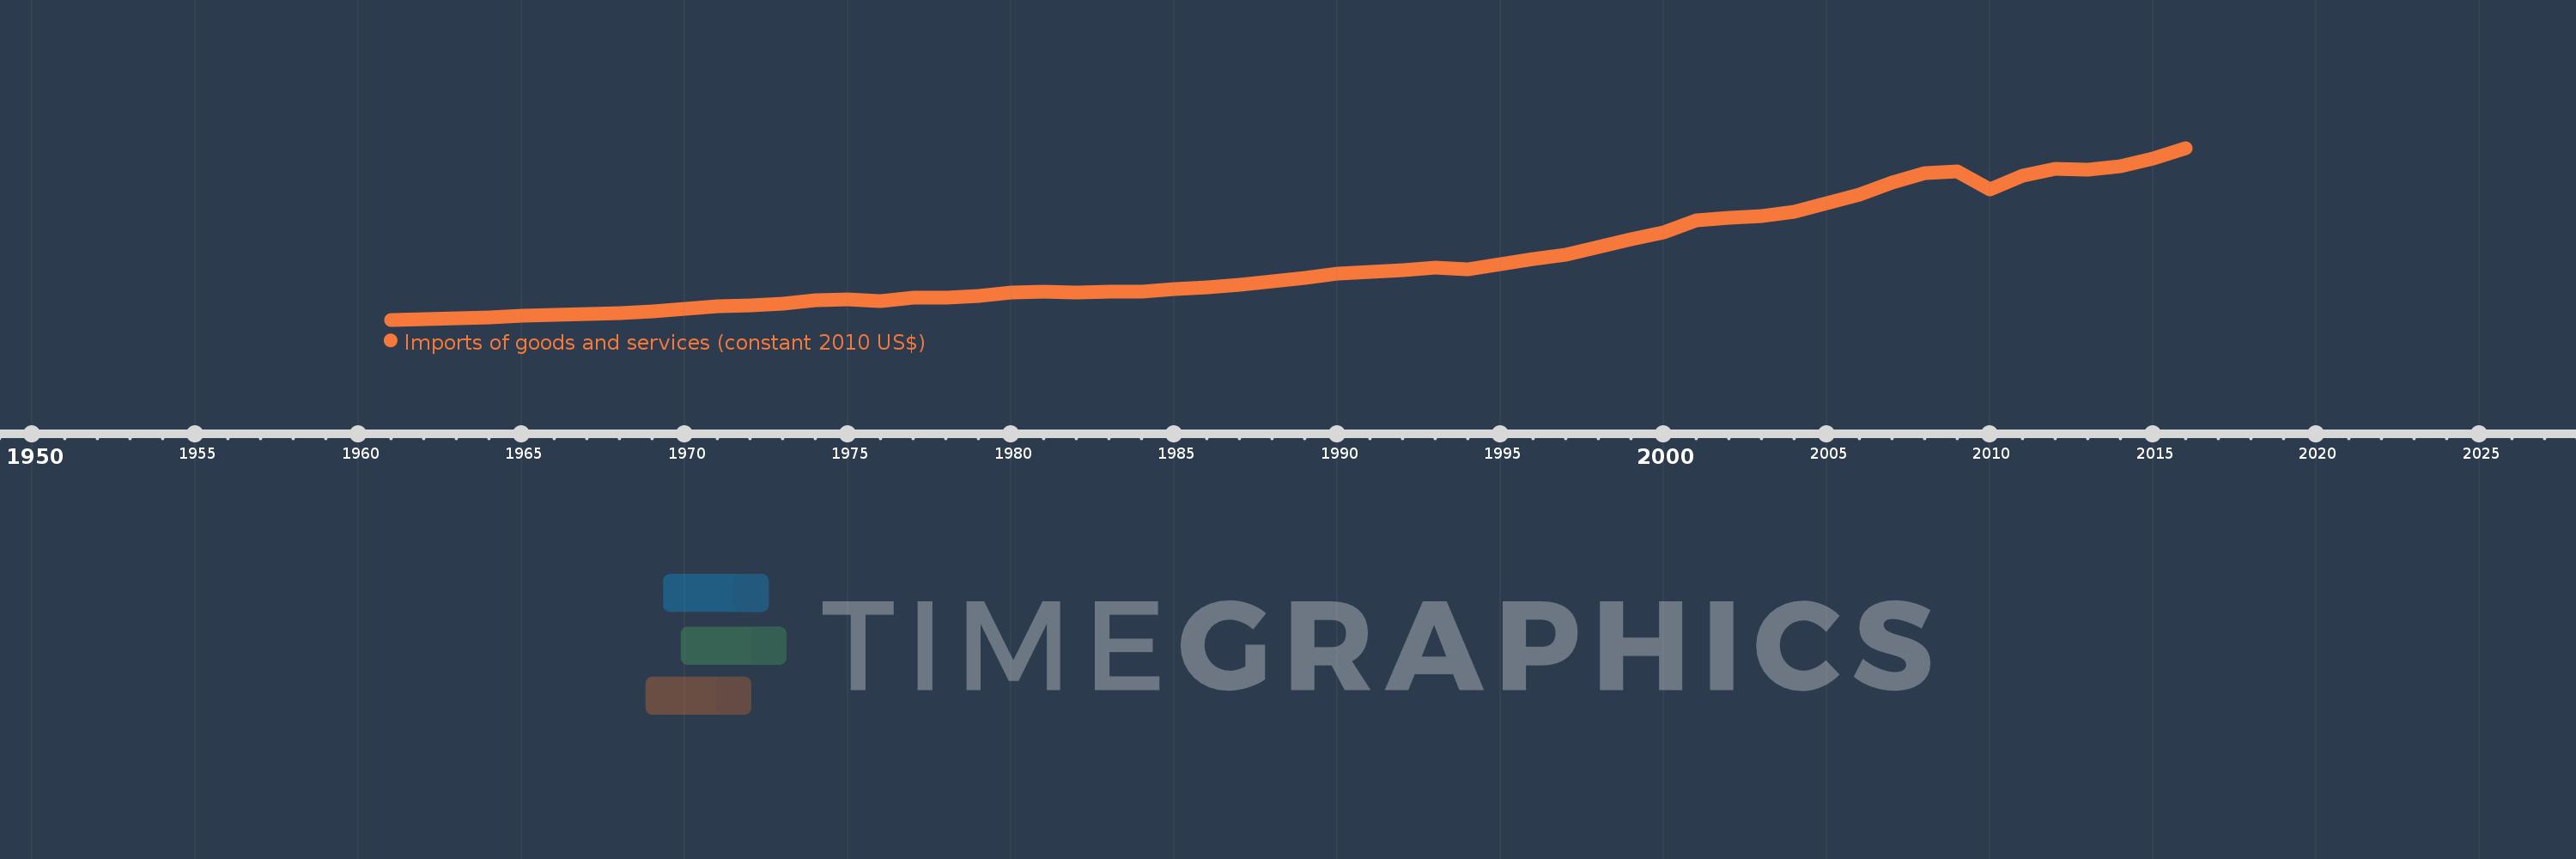
Imports of goods and services (constant 2010 US$)
2016,2015,2014,2013,2012,2011,2010,2009,2008,2007,2006,2005,2004,2003,2002,2001,2000,1999,1998,1997,1996,1995,1994,1993,1992,1991,1990,1989,1988,1987,1986,1985,1984,1983,1982,1981,1980,1979,1978,1977,1976,1975,1974,1973,1972,1971,1970,1969,1968,1967,1966,1965,1964,1963,1962,1961
Diese Statistik in anderen Ländern:
AfghanistanAlbaniaAlgeriaAngolaAntigua and BarbudaArab WorldArgentinaArmeniaArubaAustraliaAustriaAzerbaijanBahamas, TheBahrainBangladeshBarbadosBelarusBelgiumBelizeBeninBermudaBhutanBoliviaBosnia and HerzegovinaBotswanaBrazilBrunei DarussalamBulgariaBurkina FasoBurundiCabo VerdeCambodiaCameroonCanadaCaribbean small statesCentral African RepublicCentral Europe and the BalticsChadChileChinaColombiaComorosCongo, Dem. Rep.Congo, Rep.Costa RicaCote d'IvoireCroatiaCubaCyprusCzech RepublicDenmarkDominicaDominican RepublicEarly-demographic dividendEast Asia & PacificEast Asia & Pacific (excluding high income)East Asia & Pacific (IDA & IBRD countries)EcuadorEgypt, Arab Rep.El SalvadorEquatorial GuineaEritreaEstoniaEuro areaEurope & Central AsiaEurope & Central Asia (excluding high income)Europe & Central Asia (IDA & IBRD countries)European UnionFaroe IslandsFijiFinlandFragile and conflict affected situationsFranceGabonGambia, TheGeorgiaGermanyGhanaGreeceGrenadaGuatemalaGuineaGuinea-BissauGuyanaHaitiHeavily indebted poor countries (HIPC)High incomeHondurasHong Kong SAR, ChinaHungaryIBRD onlyIcelandIDA & IBRD totalIDA blendIDA onlyIDA totalIndiaIndonesiaIran, Islamic Rep.IraqIrelandIsraelItalyJamaicaJapanJordanKazakhstanKenyaKiribatiKorea, Rep.KosovoKuwaitKyrgyz RepublicLao PDRLate-demographic dividendLatin America & Caribbean Latin America & Caribbean (excluding high income)Latin America & the Caribbean (IDA & IBRD countries)LatviaLeast developed countries: UN classificationLebanonLiberiaLibyaLithuaniaLow & middle incomeLow incomeLower middle incomeLuxembourgMacao SAR, ChinaMacedonia, FYRMadagascarMalawiMalaysiaMaldivesMaliMaltaMauritaniaMauritiusMexicoMiddle East & North AfricaMiddle East & North Africa (excluding high income)Middle East & North Africa (IDA & IBRD countries)Middle incomeMoldovaMongoliaMontenegroMoroccoMozambiqueMyanmarNamibiaNepalNetherlandsNew ZealandNicaraguaNigerNigeriaNorth AmericaNorwayOECD membersOmanOther small statesPacific island small statesPakistanPalauPanamaParaguayPeruPhilippinesPolandPortugalPost-demographic dividendPre-demographic dividendPuerto RicoQatarRomaniaRussian FederationRwandaSamoaSaudi ArabiaSenegalSerbiaSeychellesSierra LeoneSingaporeSlovak RepublicSloveniaSmall statesSolomon IslandsSouth AfricaSouth AsiaSouth Asia (IDA & IBRD)South SudanSpainSri LankaSt. Kitts and NevisSt. LuciaSt. Vincent and the GrenadinesSub-Saharan Africa Sub-Saharan Africa (excluding high income)Sub-Saharan Africa (IDA & IBRD countries)SudanSurinameSwazilandSwedenSwitzerlandTajikistanTanzaniaThailandTimor-LesteTogoTongaTrinidad and TobagoTunisiaTurkeyTurkmenistanUgandaUkraineUnited Arab EmiratesUnited KingdomUnited StatesUpper middle incomeUruguayUzbekistanVanuatuVenezuela, RBVietnamWest Bank and GazaWorldYemen, Rep.ZambiaZimbabwe Zeitlinie:
Diese Zeitleiste vorliegt die Graphik ab 1961 J. bis 2016 J. European Union. Die Angaben bis 1960 J. sind nicht vorhanden. Die Zahl aktueller Beobachtungen nach Daten: 56.
Die Quelle (Bezeichnung):
Kennzahlen der Weltentwicklung
Die Quelle (Einrichtung):
World Bank national accounts data, and OECD National Accounts data files.
Kategorien:
Economy & Growth, Trade
Es wurde aktualisiert:
23 Apr 2017 Jahr
Kennzahlen der Wertänderungen vom Jahr zum Jahr
im Durchschnitt:
2.906 Trln
Minimum:
419.899 Mlrd.
1 Jan 1961 Jahr
Maximum:
7.561 Trln
1 Jan 2016 Jahr
Zum Datum der Beobachtung
Wert
Absolute Veränderung
Die Veränderung bezüglich dem vorherigen Wert
1 Jan 1961 Jahr
419.899 Mlrd.
+419.899 Mlrd.
0.0%
1 Jan 1962 Jahr
445.691 Mlrd.
+25.791 Mlrd.
6.14%
1 Jan 1963 Jahr
478.93 Mlrd.
+33.24 Mlrd.
7.46%
1 Jan 1964 Jahr
528.653 Mlrd.
+49.723 Mlrd.
10.38%
1 Jan 1965 Jahr
580.072 Mlrd.
+51.419 Mlrd.
9.73%
1 Jan 1966 Jahr
612.938 Mlrd.
+32.866 Mlrd.
5.67%
1 Jan 1967 Jahr
661.436 Mlrd.
+48.499 Mlrd.
7.91%
1 Jan 1968 Jahr
699.256 Mlrd.
+37.82 Mlrd.
5.72%
1 Jan 1969 Jahr
765.766 Mlrd.
+66.51 Mlrd.
9.51%
1 Jan 1970 Jahr
869.266 Mlrd.
+103.5 Mlrd.
13.52%
1 Jan 1971 Jahr
964.541 Mlrd.
+95.275 Mlrd.
10.96%
1 Jan 1972 Jahr
1.013 Trln
+48.197 Mlrd.
5.0%
1 Jan 1973 Jahr
1.105 Trln
+92.196 Mlrd.
9.1%
1 Jan 1974 Jahr
1.225 Trln
+119.944 Mlrd.
10.86%
1 Jan 1975 Jahr
1.256 Trln
+30.685 Mlrd.
2.51%
1 Jan 1976 Jahr
1.187 Trln
-68.133 Mlrd.
-5.43%
1 Jan 1977 Jahr
1.322 Trln
+134.306 Mlrd.
11.31%
1 Jan 1978 Jahr
1.355 Trln
+33.65 Mlrd.
2.55%
1 Jan 1979 Jahr
1.407 Trln
+51.786 Mlrd.
3.82%
1 Jan 1980 Jahr
1.544 Trln
+136.832 Mlrd.
9.72%
1 Jan 1981 Jahr
1.582 Trln
+38.366 Mlrd.
2.48%
1 Jan 1982 Jahr
1.557 Trln
-25.277 Mlrd.
-1.6%
1 Jan 1983 Jahr
1.575 Trln
+17.966 Mlrd.
1.15%
1 Jan 1984 Jahr
1.597 Trln
+22.243 Mlrd.
1.41%
1 Jan 1985 Jahr
1.702 Trln
+104.353 Mlrd.
6.53%
1 Jan 1986 Jahr
1.78 Trln
+78.609 Mlrd.
4.62%
1 Jan 1987 Jahr
1.871 Trln
+90.952 Mlrd.
5.11%
1 Jan 1988 Jahr
2.013 Trln
+141.907 Mlrd.
7.58%
1 Jan 1989 Jahr
2.163 Trln
+149.963 Mlrd.
7.45%
1 Jan 1990 Jahr
2.335 Trln
+171.578 Mlrd.
7.93%
1 Jan 1991 Jahr
2.421 Trln
+86.415 Mlrd.
3.7%
1 Jan 1992 Jahr
2.487 Trln
+65.687 Mlrd.
2.71%
1 Jan 1993 Jahr
2.591 Trln
+104.403 Mlrd.
4.2%
1 Jan 1994 Jahr
2.519 Trln
-71.732 Mlrd.
-2.77%
1 Jan 1995 Jahr
2.733 Trln
+213.846 Mlrd.
8.49%
1 Jan 1996 Jahr
2.962 Trln
+228.548 Mlrd.
8.36%
1 Jan 1997 Jahr
3.121 Trln
+158.977 Mlrd.
5.37%
1 Jan 1998 Jahr
3.432 Trln
+311.405 Mlrd.
9.98%
1 Jan 1999 Jahr
3.778 Trln
+345.807 Mlrd.
10.08%
1 Jan 2000 Jahr
4.052 Trln
+273.596 Mlrd.
7.24%
1 Jan 2001 Jahr
4.534 Trln
+482.323 Mlrd.
11.9%
1 Jan 2002 Jahr
4.655 Trln
+121.192 Mlrd.
2.67%
1 Jan 2003 Jahr
4.731 Trln
+75.826 Mlrd.
1.63%
1 Jan 2004 Jahr
4.893 Trln
+162.22 Mlrd.
3.43%
1 Jan 2005 Jahr
5.267 Trln
+373.87 Mlrd.
7.64%
1 Jan 2006 Jahr
5.607 Trln
+340.289 Mlrd.
6.46%
1 Jan 2007 Jahr
6.132 Trln
+524.278 Mlrd.
9.35%
1 Jan 2008 Jahr
6.525 Trln
+393.272 Mlrd.
6.41%
1 Jan 2009 Jahr
6.589 Trln
+64.13 Mlrd.
0.98%
1 Jan 2010 Jahr
5.838 Trln
-750.586 Mlrd.
-11.39%
1 Jan 2011 Jahr
6.405 Trln
+566.598 Mlrd.
9.7%
1 Jan 2012 Jahr
6.683 Trln
+277.645 Mlrd.
4.33%
1 Jan 2013 Jahr
6.669 Trln
-13.208 Mlrd.
-0.2%
1 Jan 2014 Jahr
6.784 Trln
+114.976 Mlrd.
1.72%
1 Jan 2015 Jahr
7.122 Trln
+337.806 Mlrd.
4.98%
1 Jan 2016 Jahr
7.561 Trln
+439.005 Mlrd.
6.16%
Bewertung der Länder gemäß mit laufender Statistik nach Jahren


Kommentare: