29
/de/
de
AIzaSyAYiBZKx7MnpbEhh9jyipgxe19OcubqV5w
April 1, 2024
27372
East Asia & Pacific
EAS
false
2
1
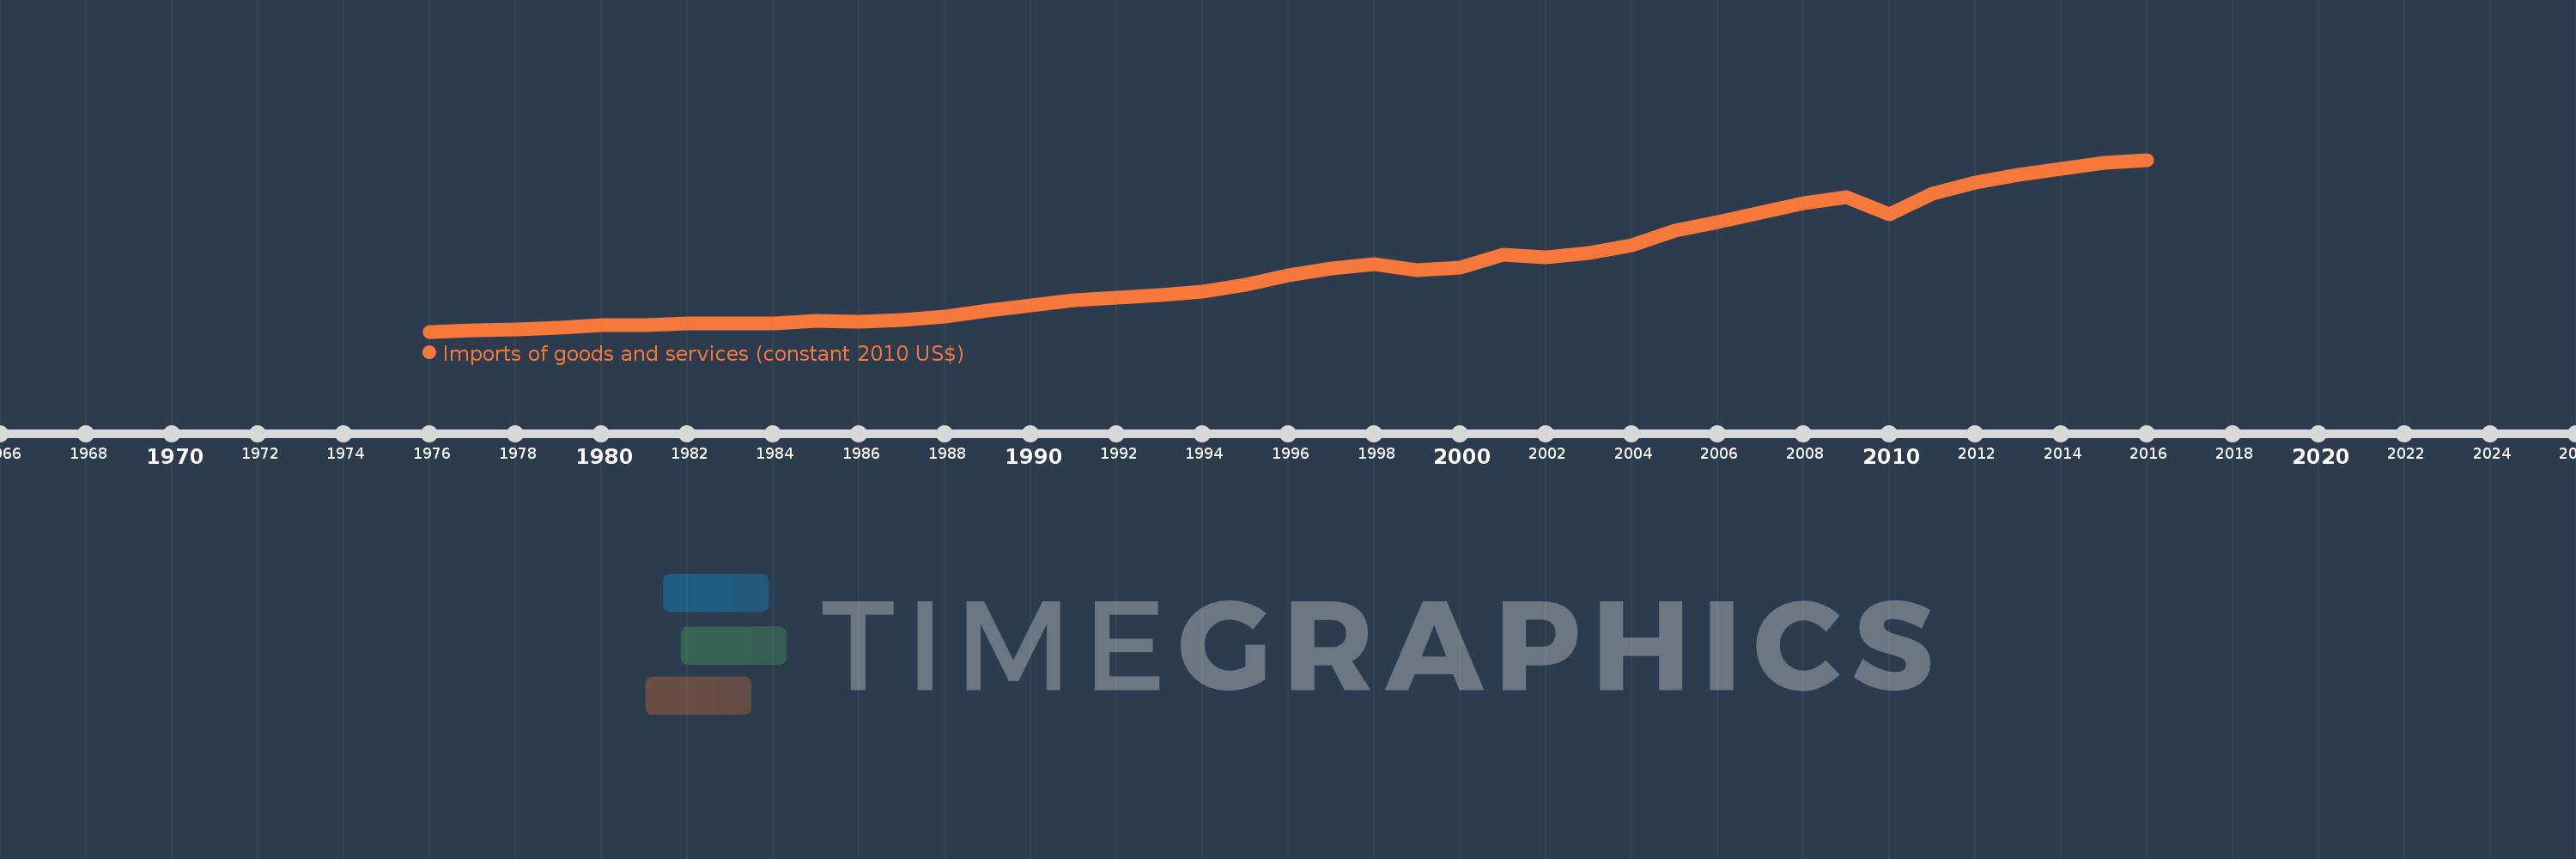
Imports of goods and services (constant 2010 US$)
2016,2015,2014,2013,2012,2011,2010,2009,2008,2007,2006,2005,2004,2003,2002,2001,2000,1999,1998,1997,1996,1995,1994,1993,1992,1991,1990,1989,1988,1987,1986,1985,1984,1983,1982,1981,1980,1979,1978,1977,1976
Diese Statistik in anderen Ländern:
AfghanistanAlbaniaAlgeriaAngolaAntigua and BarbudaArab WorldArgentinaArmeniaArubaAustraliaAustriaAzerbaijanBahamas, TheBahrainBangladeshBarbadosBelarusBelgiumBelizeBeninBermudaBhutanBoliviaBosnia and HerzegovinaBotswanaBrazilBrunei DarussalamBulgariaBurkina FasoBurundiCabo VerdeCambodiaCameroonCanadaCaribbean small statesCentral African RepublicCentral Europe and the BalticsChadChileChinaColombiaComorosCongo, Dem. Rep.Congo, Rep.Costa RicaCote d'IvoireCroatiaCubaCyprusCzech RepublicDenmarkDominicaDominican RepublicEarly-demographic dividendEast Asia & PacificEast Asia & Pacific (excluding high income)East Asia & Pacific (IDA & IBRD countries)EcuadorEgypt, Arab Rep.El SalvadorEquatorial GuineaEritreaEstoniaEuro areaEurope & Central AsiaEurope & Central Asia (excluding high income)Europe & Central Asia (IDA & IBRD countries)European UnionFaroe IslandsFijiFinlandFragile and conflict affected situationsFranceGabonGambia, TheGeorgiaGermanyGhanaGreeceGrenadaGuatemalaGuineaGuinea-BissauGuyanaHaitiHeavily indebted poor countries (HIPC)High incomeHondurasHong Kong SAR, ChinaHungaryIBRD onlyIcelandIDA & IBRD totalIDA blendIDA onlyIDA totalIndiaIndonesiaIran, Islamic Rep.IraqIrelandIsraelItalyJamaicaJapanJordanKazakhstanKenyaKiribatiKorea, Rep.KosovoKuwaitKyrgyz RepublicLao PDRLate-demographic dividendLatin America & Caribbean Latin America & Caribbean (excluding high income)Latin America & the Caribbean (IDA & IBRD countries)LatviaLeast developed countries: UN classificationLebanonLiberiaLibyaLithuaniaLow & middle incomeLow incomeLower middle incomeLuxembourgMacao SAR, ChinaMacedonia, FYRMadagascarMalawiMalaysiaMaldivesMaliMaltaMauritaniaMauritiusMexicoMiddle East & North AfricaMiddle East & North Africa (excluding high income)Middle East & North Africa (IDA & IBRD countries)Middle incomeMoldovaMongoliaMontenegroMoroccoMozambiqueMyanmarNamibiaNepalNetherlandsNew ZealandNicaraguaNigerNigeriaNorth AmericaNorwayOECD membersOmanOther small statesPacific island small statesPakistanPalauPanamaParaguayPeruPhilippinesPolandPortugalPost-demographic dividendPre-demographic dividendPuerto RicoQatarRomaniaRussian FederationRwandaSamoaSaudi ArabiaSenegalSerbiaSeychellesSierra LeoneSingaporeSlovak RepublicSloveniaSmall statesSolomon IslandsSouth AfricaSouth AsiaSouth Asia (IDA & IBRD)South SudanSpainSri LankaSt. Kitts and NevisSt. LuciaSt. Vincent and the GrenadinesSub-Saharan Africa Sub-Saharan Africa (excluding high income)Sub-Saharan Africa (IDA & IBRD countries)SudanSurinameSwazilandSwedenSwitzerlandTajikistanTanzaniaThailandTimor-LesteTogoTongaTrinidad and TobagoTunisiaTurkeyTurkmenistanUgandaUkraineUnited Arab EmiratesUnited KingdomUnited StatesUpper middle incomeUruguayUzbekistanVanuatuVenezuela, RBVietnamWest Bank and GazaWorldYemen, Rep.ZambiaZimbabwe Zeitlinie:
Diese Zeitleiste vorliegt die Graphik ab 1976 J. bis 2016 J. East Asia & Pacific. Die Angaben bis 1975 J. sind nicht vorhanden. Die Zahl aktueller Beobachtungen nach Daten: 41.
Die Quelle (Bezeichnung):
Kennzahlen der Weltentwicklung
Die Quelle (Einrichtung):
World Bank national accounts data, and OECD National Accounts data files.
Kategorien:
Economy & Growth, Trade
Es wurde aktualisiert:
23 Apr 2017 Jahr
Kennzahlen der Wertänderungen vom Jahr zum Jahr
im Durchschnitt:
2.526 Trln
Minimum:
494.89 Mlrd.
1 Jan 1976 Jahr
Maximum:
5.967 Trln
1 Jan 2016 Jahr
Zum Datum der Beobachtung
Wert
Absolute Veränderung
Die Veränderung bezüglich dem vorherigen Wert
1 Jan 1976 Jahr
494.89 Mlrd.
+494.89 Mlrd.
0.0%
1 Jan 1977 Jahr
536.96 Mlrd.
+42.07 Mlrd.
8.5%
1 Jan 1978 Jahr
572.006 Mlrd.
+35.046 Mlrd.
6.53%
1 Jan 1979 Jahr
623.657 Mlrd.
+51.651 Mlrd.
9.03%
1 Jan 1980 Jahr
710.768 Mlrd.
+87.111 Mlrd.
13.97%
1 Jan 1981 Jahr
706.79 Mlrd.
-3.979 Mlrd.
-0.56%
1 Jan 1982 Jahr
750.835 Mlrd.
+44.046 Mlrd.
6.23%
1 Jan 1983 Jahr
757.304 Mlrd.
+6.469 Mlrd.
0.86%
1 Jan 1984 Jahr
764.891 Mlrd.
+7.587 Mlrd.
1.0%
1 Jan 1985 Jahr
824.93 Mlrd.
+60.039 Mlrd.
7.85%
1 Jan 1986 Jahr
817.027 Mlrd.
-7.902 Mlrd.
-0.96%
1 Jan 1987 Jahr
871.875 Mlrd.
+54.847 Mlrd.
6.71%
1 Jan 1988 Jahr
985.119 Mlrd.
+113.245 Mlrd.
12.99%
1 Jan 1989 Jahr
1.157 Trln
+171.521 Mlrd.
17.41%
1 Jan 1990 Jahr
1.337 Trln
+180.72 Mlrd.
15.62%
1 Jan 1991 Jahr
1.481 Trln
+143.463 Mlrd.
10.73%
1 Jan 1992 Jahr
1.578 Trln
+97.146 Mlrd.
6.56%
1 Jan 1993 Jahr
1.666 Trln
+87.666 Mlrd.
5.56%
1 Jan 1994 Jahr
1.766 Trln
+99.919 Mlrd.
6.0%
1 Jan 1995 Jahr
1.988 Trln
+222.81 Mlrd.
12.62%
1 Jan 1996 Jahr
2.298 Trln
+309.92 Mlrd.
15.59%
1 Jan 1997 Jahr
2.512 Trln
+214.047 Mlrd.
9.31%
1 Jan 1998 Jahr
2.65 Trln
+137.308 Mlrd.
5.47%
1 Jan 1999 Jahr
2.45 Trln
-199.633 Mlrd.
-7.53%
1 Jan 2000 Jahr
2.539 Trln
+88.552 Mlrd.
3.61%
1 Jan 2001 Jahr
2.936 Trln
+397.893 Mlrd.
15.67%
1 Jan 2002 Jahr
2.865 Trln
-71.269 Mlrd.
-2.43%
1 Jan 2003 Jahr
3.008 Trln
+142.997 Mlrd.
4.99%
1 Jan 2004 Jahr
3.243 Trln
+234.427 Mlrd.
7.79%
1 Jan 2005 Jahr
3.699 Trln
+456.375 Mlrd.
14.07%
1 Jan 2006 Jahr
3.993 Trln
+294.227 Mlrd.
7.95%
1 Jan 2007 Jahr
4.289 Trln
+295.53 Mlrd.
7.4%
1 Jan 2008 Jahr
4.584 Trln
+294.821 Mlrd.
6.87%
1 Jan 2009 Jahr
4.774 Trln
+190.059 Mlrd.
4.15%
1 Jan 2010 Jahr
4.219 Trln
-554.739 Mlrd.
-11.62%
1 Jan 2011 Jahr
4.882 Trln
+662.663 Mlrd.
15.71%
1 Jan 2012 Jahr
5.239 Trln
+357.575 Mlrd.
7.33%
1 Jan 2013 Jahr
5.476 Trln
+236.562 Mlrd.
4.52%
1 Jan 2014 Jahr
5.685 Trln
+209.01 Mlrd.
3.82%
1 Jan 2015 Jahr
5.879 Trln
+194.587 Mlrd.
3.42%
1 Jan 2016 Jahr
5.967 Trln
+87.928 Mlrd.
1.5%
Bewertung der Länder gemäß mit laufender Statistik nach Jahren


Kommentare: