29
/de/
de
AIzaSyAYiBZKx7MnpbEhh9jyipgxe19OcubqV5w
April 1, 2024
31661
Europe & Central Asia (excluding high income)
ECA
false
2
1
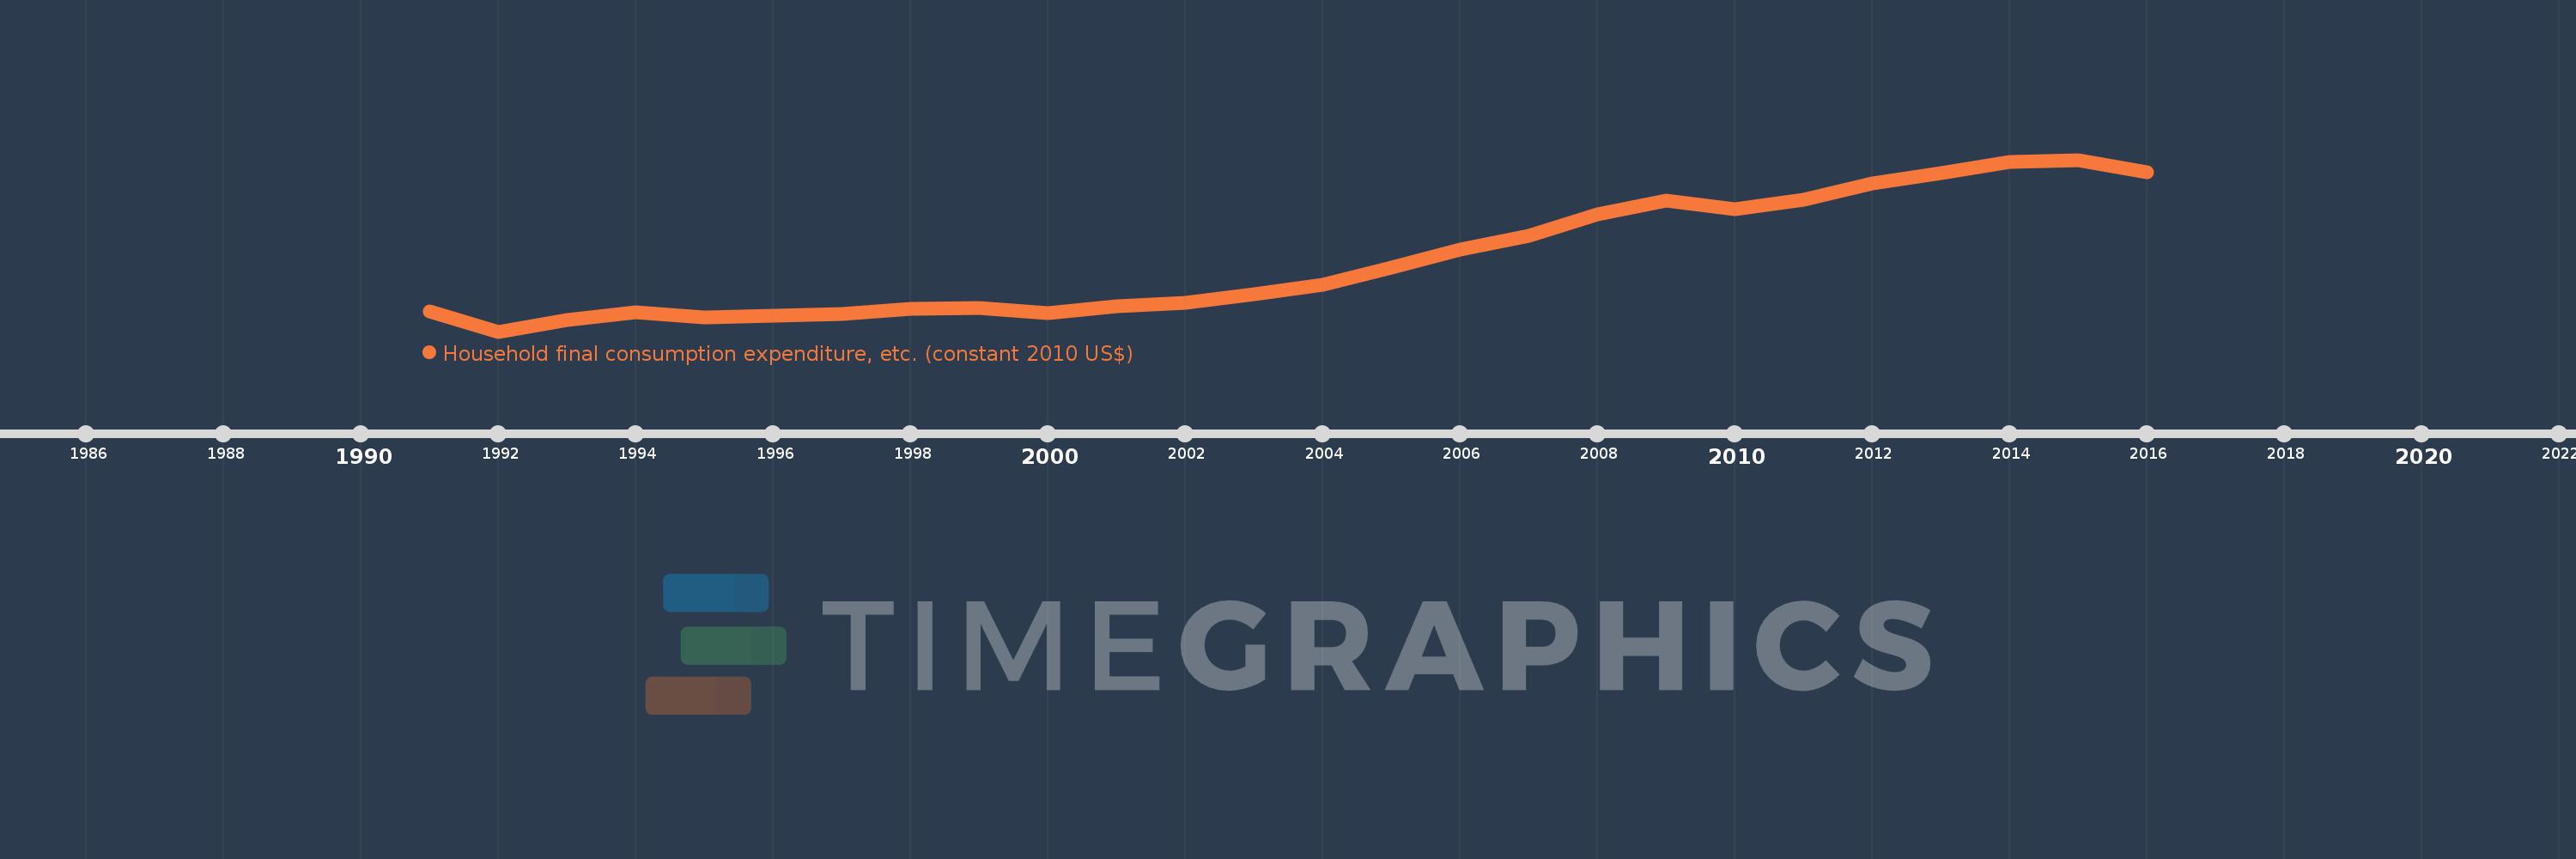
Household final consumption expenditure, etc. (constant 2010 US$)
2016,2015,2014,2013,2012,2011,2010,2009,2008,2007,2006,2005,2004,2003,2002,2001,2000,1999,1998,1997,1996,1995,1994,1993,1992,1991
Diese Statistik in anderen Ländern:
AfghanistanAlbaniaAlgeriaAngolaAntigua and BarbudaArab WorldArgentinaArmeniaArubaAustraliaAustriaAzerbaijanBahamas, TheBahrainBangladeshBarbadosBelarusBelgiumBelizeBeninBermudaBhutanBoliviaBosnia and HerzegovinaBotswanaBrazilBrunei DarussalamBulgariaBurkina FasoBurundiCabo VerdeCambodiaCameroonCanadaCaribbean small statesCentral African RepublicCentral Europe and the BalticsChadChileChinaColombiaComorosCongo, Dem. Rep.Congo, Rep.Cote d'IvoireCroatiaCubaCyprusCzech RepublicDenmarkDominicaDominican RepublicEarly-demographic dividendEast Asia & PacificEast Asia & Pacific (excluding high income)East Asia & Pacific (IDA & IBRD countries)EcuadorEgypt, Arab Rep.El SalvadorEquatorial GuineaEritreaEstoniaEuro areaEurope & Central AsiaEurope & Central Asia (excluding high income)Europe & Central Asia (IDA & IBRD countries)European UnionFaroe IslandsFinlandFragile and conflict affected situationsFranceGabonGambia, TheGeorgiaGermanyGhanaGreeceGrenadaGuatemalaGuineaGuinea-BissauGuyanaHaitiHeavily indebted poor countries (HIPC)High incomeHondurasHong Kong SAR, ChinaHungaryIBRD onlyIcelandIDA & IBRD totalIDA blendIDA onlyIDA totalIndiaIndonesiaIran, Islamic Rep.IraqIrelandIsraelItalyJamaicaJapanJordanKazakhstanKenyaKorea, Rep.KosovoKuwaitKyrgyz RepublicLao PDRLate-demographic dividendLatin America & Caribbean Latin America & Caribbean (excluding high income)Latin America & the Caribbean (IDA & IBRD countries)LatviaLeast developed countries: UN classificationLebanonLiberiaLithuaniaLow & middle incomeLow incomeLower middle incomeLuxembourgMacao SAR, ChinaMacedonia, FYRMadagascarMalawiMalaysiaMaliMaltaMauritaniaMauritiusMexicoMiddle East & North AfricaMiddle East & North Africa (excluding high income)Middle East & North Africa (IDA & IBRD countries)Middle incomeMoldovaMongoliaMontenegroMoroccoMozambiqueNamibiaNepalNetherlandsNew ZealandNicaraguaNigerNigeriaNorth AmericaNorwayOECD membersOmanOther small statesPakistanPanamaParaguayPeruPhilippinesPolandPortugalPost-demographic dividendPre-demographic dividendPuerto RicoQatarRomaniaRussian FederationRwandaSaudi ArabiaSenegalSerbiaSeychellesSierra LeoneSingaporeSlovak RepublicSloveniaSmall statesSouth AfricaSouth AsiaSouth Asia (IDA & IBRD)South SudanSpainSri LankaSt. Kitts and NevisSt. LuciaSt. Vincent and the GrenadinesSub-Saharan Africa Sub-Saharan Africa (excluding high income)Sub-Saharan Africa (IDA & IBRD countries)SudanSurinameSwazilandSwedenSwitzerlandTajikistanTanzaniaThailandTimor-LesteTogoTongaTrinidad and TobagoTunisiaTurkeyTurkmenistanUgandaUkraineUnited Arab EmiratesUnited KingdomUnited StatesUpper middle incomeUruguayUzbekistanVanuatuVenezuela, RBVietnamWest Bank and GazaWorldYemen, Rep.ZambiaZimbabwe Zeitlinie:
Diese Zeitleiste vorliegt die Graphik ab 1991 J. bis 2016 J. Europe & Central Asia (excluding high income). Die Angaben bis 1990 J. sind nicht vorhanden. Die Zahl aktueller Beobachtungen nach Daten: 26.
Die Quelle (Bezeichnung):
Kennzahlen der Weltentwicklung
Die Quelle (Einrichtung):
World Bank national accounts data, and OECD National Accounts data files.
Kategorien:
Economy & Growth
Es wurde aktualisiert:
23 Apr 2017 Jahr
Kennzahlen der Wertänderungen vom Jahr zum Jahr
im Durchschnitt:
1.293 Trln
Minimum:
734.735 Mlrd.
1 Jan 1992 Jahr
Maximum:
2.08 Trln
1 Jan 2015 Jahr
Zum Datum der Beobachtung
Wert
Absolute Veränderung
Die Veränderung bezüglich dem vorherigen Wert
1 Jan 1991 Jahr
889.839 Mlrd.
+889.839 Mlrd.
0.0%
1 Jan 1992 Jahr
734.735 Mlrd.
-155.104 Mlrd.
-17.43%
1 Jan 1993 Jahr
822.917 Mlrd.
+88.182 Mlrd.
12.0%
1 Jan 1994 Jahr
888.662 Mlrd.
+65.745 Mlrd.
7.99%
1 Jan 1995 Jahr
842.456 Mlrd.
-46.206 Mlrd.
-5.2%
1 Jan 1996 Jahr
856.998 Mlrd.
+14.542 Mlrd.
1.73%
1 Jan 1997 Jahr
871.472 Mlrd.
+14.473 Mlrd.
1.69%
1 Jan 1998 Jahr
914.094 Mlrd.
+42.623 Mlrd.
4.89%
1 Jan 1999 Jahr
917.161 Mlrd.
+3.067 Mlrd.
0.34%
1 Jan 2000 Jahr
882.447 Mlrd.
-34.714 Mlrd.
-3.78%
1 Jan 2001 Jahr
936.026 Mlrd.
+53.579 Mlrd.
6.07%
1 Jan 2002 Jahr
958.352 Mlrd.
+22.326 Mlrd.
2.39%
1 Jan 2003 Jahr
1.024 Trln
+65.902 Mlrd.
6.88%
1 Jan 2004 Jahr
1.104 Trln
+79.687 Mlrd.
7.78%
1 Jan 2005 Jahr
1.234 Trln
+130.085 Mlrd.
11.78%
1 Jan 2006 Jahr
1.375 Trln
+140.852 Mlrd.
11.41%
1 Jan 2007 Jahr
1.487 Trln
+111.807 Mlrd.
8.13%
1 Jan 2008 Jahr
1.654 Trln
+166.914 Mlrd.
11.23%
1 Jan 2009 Jahr
1.762 Trln
+107.944 Mlrd.
6.53%
1 Jan 2010 Jahr
1.691 Trln
-70.284 Mlrd.
-3.99%
1 Jan 2011 Jahr
1.769 Trln
+77.849 Mlrd.
4.6%
1 Jan 2012 Jahr
1.892 Trln
+122.586 Mlrd.
6.93%
1 Jan 2013 Jahr
1.975 Trln
+83.275 Mlrd.
4.4%
1 Jan 2014 Jahr
2.063 Trln
+87.727 Mlrd.
4.44%
1 Jan 2015 Jahr
2.08 Trln
+17.265 Mlrd.
0.84%
1 Jan 2016 Jahr
1.984 Trln
-95.939 Mlrd.
-4.61%
Bewertung der Länder gemäß mit laufender Statistik nach Jahren


Kommentare: