29
/de/
de
AIzaSyAYiBZKx7MnpbEhh9jyipgxe19OcubqV5w
April 1, 2024
30755
Europe & Central Asia
ECS
false
2
1
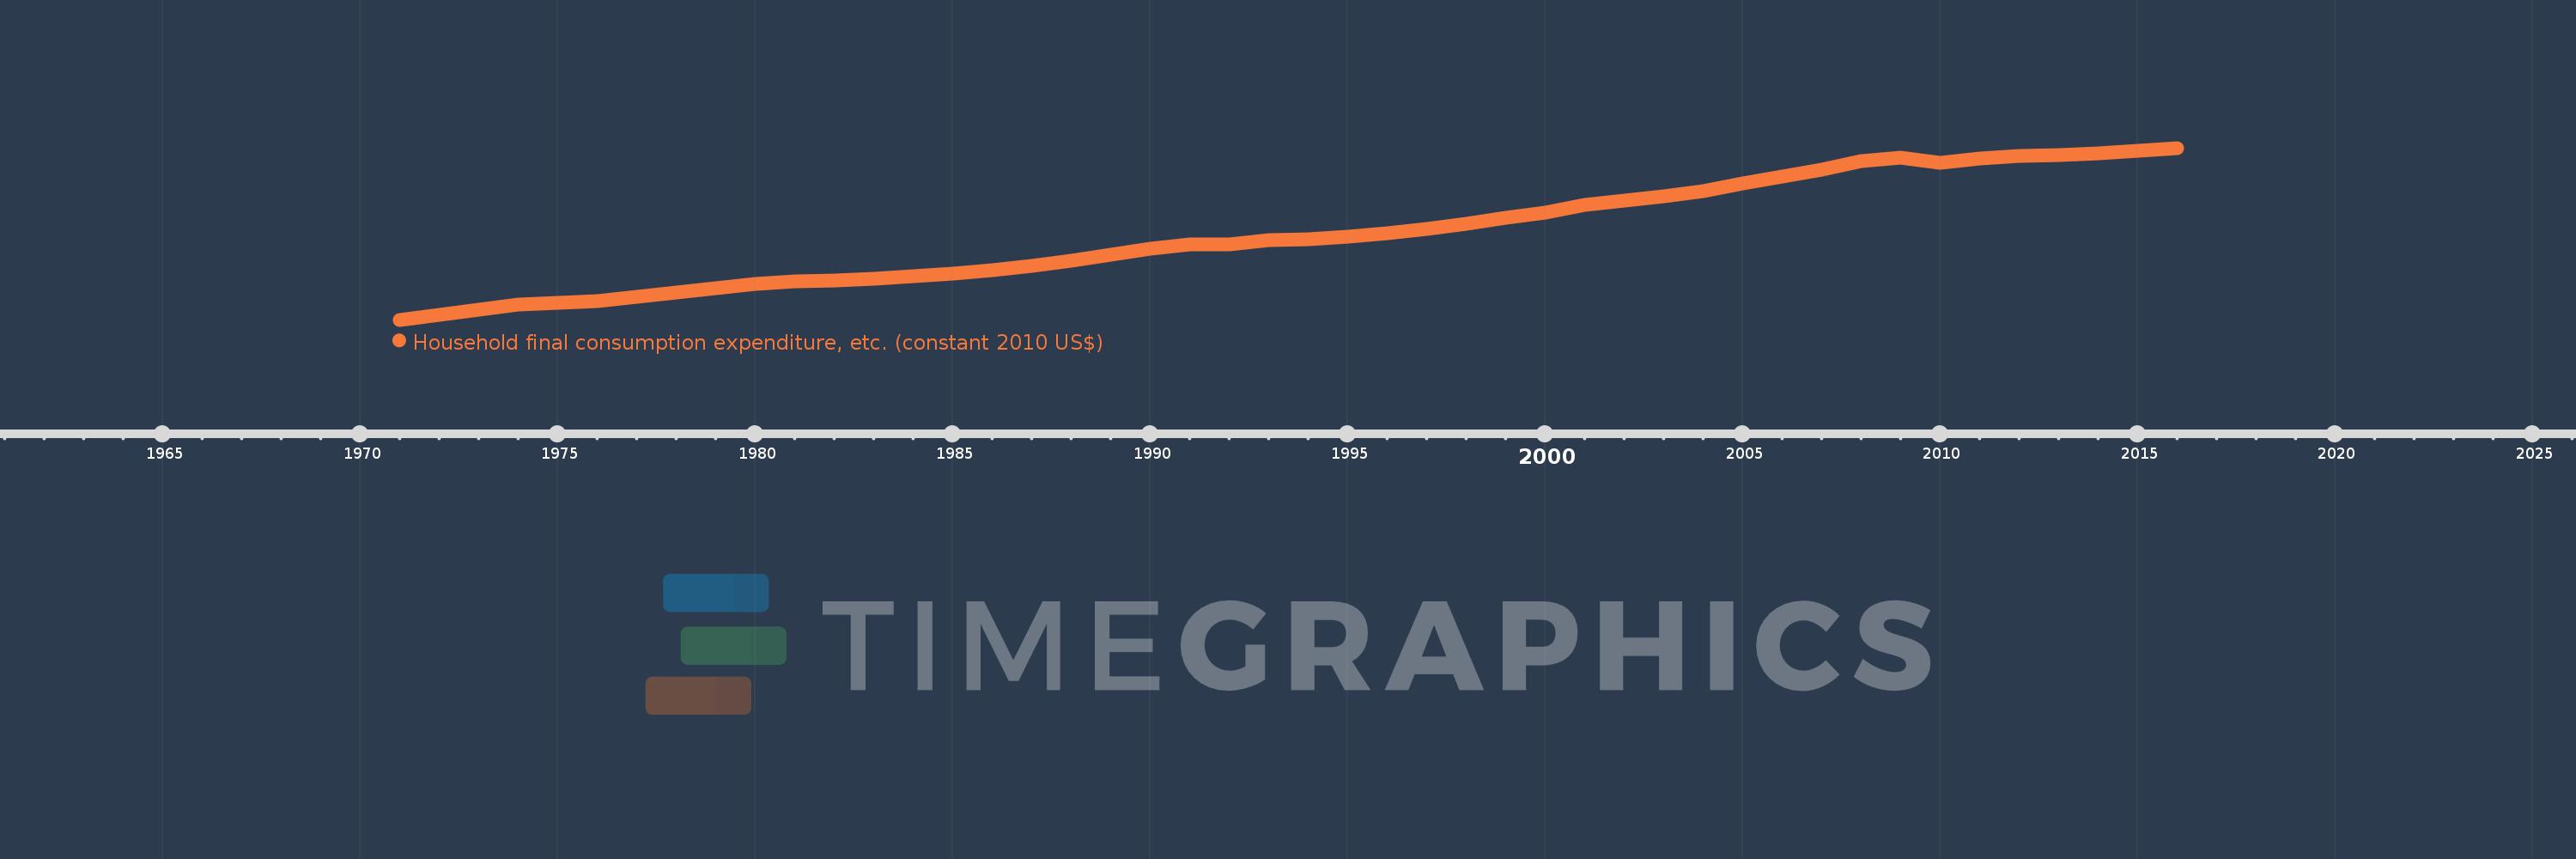
Household final consumption expenditure, etc. (constant 2010 US$)
2016,2015,2014,2013,2012,2011,2010,2009,2008,2007,2006,2005,2004,2003,2002,2001,2000,1999,1998,1997,1996,1995,1994,1993,1992,1991,1990,1989,1988,1987,1986,1985,1984,1983,1982,1981,1980,1979,1978,1977,1976,1975,1974,1973,1972,1971
Diese Statistik in anderen Ländern:
AfghanistanAlbaniaAlgeriaAngolaAntigua and BarbudaArab WorldArgentinaArmeniaArubaAustraliaAustriaAzerbaijanBahamas, TheBahrainBangladeshBarbadosBelarusBelgiumBelizeBeninBermudaBhutanBoliviaBosnia and HerzegovinaBotswanaBrazilBrunei DarussalamBulgariaBurkina FasoBurundiCabo VerdeCambodiaCameroonCanadaCaribbean small statesCentral African RepublicCentral Europe and the BalticsChadChileChinaColombiaComorosCongo, Dem. Rep.Congo, Rep.Cote d'IvoireCroatiaCubaCyprusCzech RepublicDenmarkDominicaDominican RepublicEarly-demographic dividendEast Asia & PacificEast Asia & Pacific (excluding high income)East Asia & Pacific (IDA & IBRD countries)EcuadorEgypt, Arab Rep.El SalvadorEquatorial GuineaEritreaEstoniaEuro areaEurope & Central AsiaEurope & Central Asia (excluding high income)Europe & Central Asia (IDA & IBRD countries)European UnionFaroe IslandsFinlandFragile and conflict affected situationsFranceGabonGambia, TheGeorgiaGermanyGhanaGreeceGrenadaGuatemalaGuineaGuinea-BissauGuyanaHaitiHeavily indebted poor countries (HIPC)High incomeHondurasHong Kong SAR, ChinaHungaryIBRD onlyIcelandIDA & IBRD totalIDA blendIDA onlyIDA totalIndiaIndonesiaIran, Islamic Rep.IraqIrelandIsraelItalyJamaicaJapanJordanKazakhstanKenyaKorea, Rep.KosovoKuwaitKyrgyz RepublicLao PDRLate-demographic dividendLatin America & Caribbean Latin America & Caribbean (excluding high income)Latin America & the Caribbean (IDA & IBRD countries)LatviaLeast developed countries: UN classificationLebanonLiberiaLithuaniaLow & middle incomeLow incomeLower middle incomeLuxembourgMacao SAR, ChinaMacedonia, FYRMadagascarMalawiMalaysiaMaliMaltaMauritaniaMauritiusMexicoMiddle East & North AfricaMiddle East & North Africa (excluding high income)Middle East & North Africa (IDA & IBRD countries)Middle incomeMoldovaMongoliaMontenegroMoroccoMozambiqueNamibiaNepalNetherlandsNew ZealandNicaraguaNigerNigeriaNorth AmericaNorwayOECD membersOmanOther small statesPakistanPanamaParaguayPeruPhilippinesPolandPortugalPost-demographic dividendPre-demographic dividendPuerto RicoQatarRomaniaRussian FederationRwandaSaudi ArabiaSenegalSerbiaSeychellesSierra LeoneSingaporeSlovak RepublicSloveniaSmall statesSouth AfricaSouth AsiaSouth Asia (IDA & IBRD)South SudanSpainSri LankaSt. Kitts and NevisSt. LuciaSt. Vincent and the GrenadinesSub-Saharan Africa Sub-Saharan Africa (excluding high income)Sub-Saharan Africa (IDA & IBRD countries)SudanSurinameSwazilandSwedenSwitzerlandTajikistanTanzaniaThailandTimor-LesteTogoTongaTrinidad and TobagoTunisiaTurkeyTurkmenistanUgandaUkraineUnited Arab EmiratesUnited KingdomUnited StatesUpper middle incomeUruguayUzbekistanVanuatuVenezuela, RBVietnamWest Bank and GazaWorldYemen, Rep.ZambiaZimbabwe Zeitlinie:
Diese Zeitleiste vorliegt die Graphik ab 1971 J. bis 2016 J. Europe & Central Asia. Die Angaben bis 1970 J. sind nicht vorhanden. Die Zahl aktueller Beobachtungen nach Daten: 46.
Die Quelle (Bezeichnung):
Kennzahlen der Weltentwicklung
Die Quelle (Einrichtung):
World Bank national accounts data, and OECD National Accounts data files.
Kategorien:
Economy & Growth
Es wurde aktualisiert:
23 Apr 2017 Jahr
Kennzahlen der Wertänderungen vom Jahr zum Jahr
im Durchschnitt:
8.384 Trln
Minimum:
4.38 Trln
1 Jan 1971 Jahr
Maximum:
12.376 Trln
1 Jan 2016 Jahr
Zum Datum der Beobachtung
Wert
Absolute Veränderung
Die Veränderung bezüglich dem vorherigen Wert
1 Jan 1971 Jahr
4.38 Trln
+4.38 Trln
0.0%
1 Jan 1972 Jahr
4.589 Trln
+208.967 Mlrd.
4.77%
1 Jan 1973 Jahr
4.844 Trln
+255.088 Mlrd.
5.56%
1 Jan 1974 Jahr
5.09 Trln
+246.469 Mlrd.
5.09%
1 Jan 1975 Jahr
5.175 Trln
+84.971 Mlrd.
1.67%
1 Jan 1976 Jahr
5.244 Trln
+69.035 Mlrd.
1.33%
1 Jan 1977 Jahr
5.451 Trln
+206.352 Mlrd.
3.93%
1 Jan 1978 Jahr
5.64 Trln
+189.42 Mlrd.
3.48%
1 Jan 1979 Jahr
5.846 Trln
+205.465 Mlrd.
3.64%
1 Jan 1980 Jahr
6.065 Trln
+218.93 Mlrd.
3.75%
1 Jan 1981 Jahr
6.15 Trln
+85.493 Mlrd.
1.41%
1 Jan 1982 Jahr
6.219 Trln
+69.32 Mlrd.
1.13%
1 Jan 1983 Jahr
6.281 Trln
+61.753 Mlrd.
0.99%
1 Jan 1984 Jahr
6.391 Trln
+109.85 Mlrd.
1.75%
1 Jan 1985 Jahr
6.512 Trln
+121.347 Mlrd.
1.9%
1 Jan 1986 Jahr
6.692 Trln
+179.301 Mlrd.
2.75%
1 Jan 1987 Jahr
6.905 Trln
+213.249 Mlrd.
3.19%
1 Jan 1988 Jahr
7.143 Trln
+238.425 Mlrd.
3.45%
1 Jan 1989 Jahr
7.423 Trln
+280.207 Mlrd.
3.92%
1 Jan 1990 Jahr
7.677 Trln
+253.976 Mlrd.
3.42%
1 Jan 1991 Jahr
7.89 Trln
+212.106 Mlrd.
2.76%
1 Jan 1992 Jahr
7.872 Trln
-17.094 Mlrd.
-0.22%
1 Jan 1993 Jahr
8.077 Trln
+204.424 Mlrd.
2.6%
1 Jan 1994 Jahr
8.141 Trln
+64.562 Mlrd.
0.8%
1 Jan 1995 Jahr
8.249 Trln
+107.084 Mlrd.
1.32%
1 Jan 1996 Jahr
8.401 Trln
+152.788 Mlrd.
1.85%
1 Jan 1997 Jahr
8.603 Trln
+201.217 Mlrd.
2.4%
1 Jan 1998 Jahr
8.859 Trln
+256.681 Mlrd.
2.98%
1 Jan 1999 Jahr
9.115 Trln
+255.67 Mlrd.
2.89%
1 Jan 2000 Jahr
9.366 Trln
+251.011 Mlrd.
2.75%
1 Jan 2001 Jahr
9.711 Trln
+344.974 Mlrd.
3.68%
1 Jan 2002 Jahr
9.929 Trln
+217.758 Mlrd.
2.24%
1 Jan 2003 Jahr
10.138 Trln
+208.938 Mlrd.
2.1%
1 Jan 2004 Jahr
10.366 Trln
+228.517 Mlrd.
2.25%
1 Jan 2005 Jahr
10.708 Trln
+341.731 Mlrd.
3.3%
1 Jan 2006 Jahr
11.058 Trln
+349.789 Mlrd.
3.27%
1 Jan 2007 Jahr
11.384 Trln
+326.441 Mlrd.
2.95%
1 Jan 2008 Jahr
11.768 Trln
+383.686 Mlrd.
3.37%
1 Jan 2009 Jahr
11.907 Trln
+139.224 Mlrd.
1.18%
1 Jan 2010 Jahr
11.694 Trln
-212.681 Mlrd.
-1.79%
1 Jan 2011 Jahr
11.871 Trln
+177.093 Mlrd.
1.51%
1 Jan 2012 Jahr
12.001 Trln
+129.23 Mlrd.
1.09%
1 Jan 2013 Jahr
12.047 Trln
+46.755 Mlrd.
0.39%
1 Jan 2014 Jahr
12.134 Trln
+86.804 Mlrd.
0.72%
1 Jan 2015 Jahr
12.26 Trln
+125.423 Mlrd.
1.03%
1 Jan 2016 Jahr
12.376 Trln
+116.117 Mlrd.
0.95%
Bewertung der Länder gemäß mit laufender Statistik nach Jahren


Kommentare: